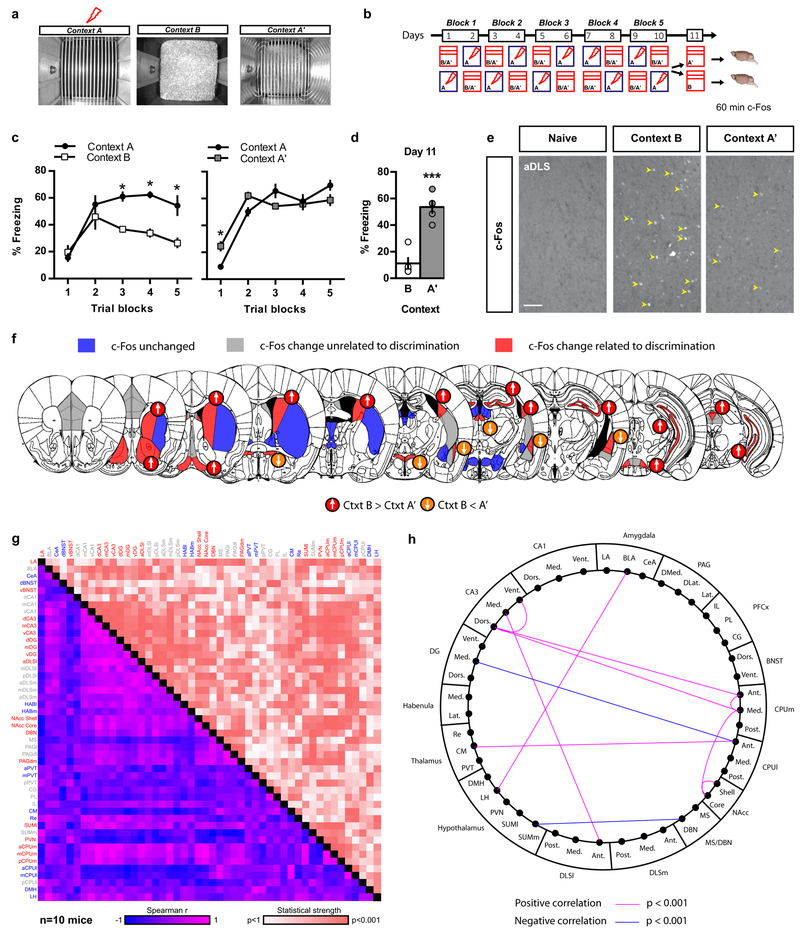
Figure 1. Contextual fear discrimination is associated with activation of a DG-CA3-DLS network.
a-b) Schematic representation of CFCDL procedure in which mice were trained to discriminate between a footshock delivered in context A and a safe context B (group AB) or A’ (group AA’). c) Freezing behavior in AB and AA’ groups over 5 blocks of training. Means ± SEM; n= 5, 5 mice per group, mixed factor two-way ANOVA (repeated measure over time): group AB: time F (4, 32) = 13.83, P < 0.001; context F (1, 8) = 20.83, P < 0.01; interaction F (4, 32) = 3.676, P < 0.01; group AA’: time F (4, 32) = 47.71, P < 0.001; context F (1, 8) = 0.04855, NS; interaction F (4, 32) = 5.043, P < 0.01. *p < 0.05, context A versus context B or A’. d) Freezing behavior during final exposure to the safe context. Means ± SEM; n= 5, 5 mice per group, unpaired Student two-tailed T-test, ***p < 0.001, context B versus A’. e) c-Fos immunohistochemistry (yellow arrowheads) in mice previously exposed to context B or A’ as well as a naive control group. Representative images for 5 independent animals per group. Scale bar: 50 μm. f) Schematic depicting brain-wide c-Fos analysis in AB and AA’ mice as compared to naive controls. c-Fos immunoreactivity unchanged (blue), B and A’ different from naive (grey), and B and A’ different from each other (red). Arrows indicate c-Fos changes in relation to freezing behavior. g) Inter-regional correlations for brain-wide c-Fos immunoreactivity using within-and between-subject design in context A’ and B. h) Schematic representation of the most robust inter-regional correlations (data are corrected for multiple comparisons). Note the robust positive correlations between CA3 and DLS but not CA1. See methods and statistics detailed in Supplementary Table 1 and Table 2.

