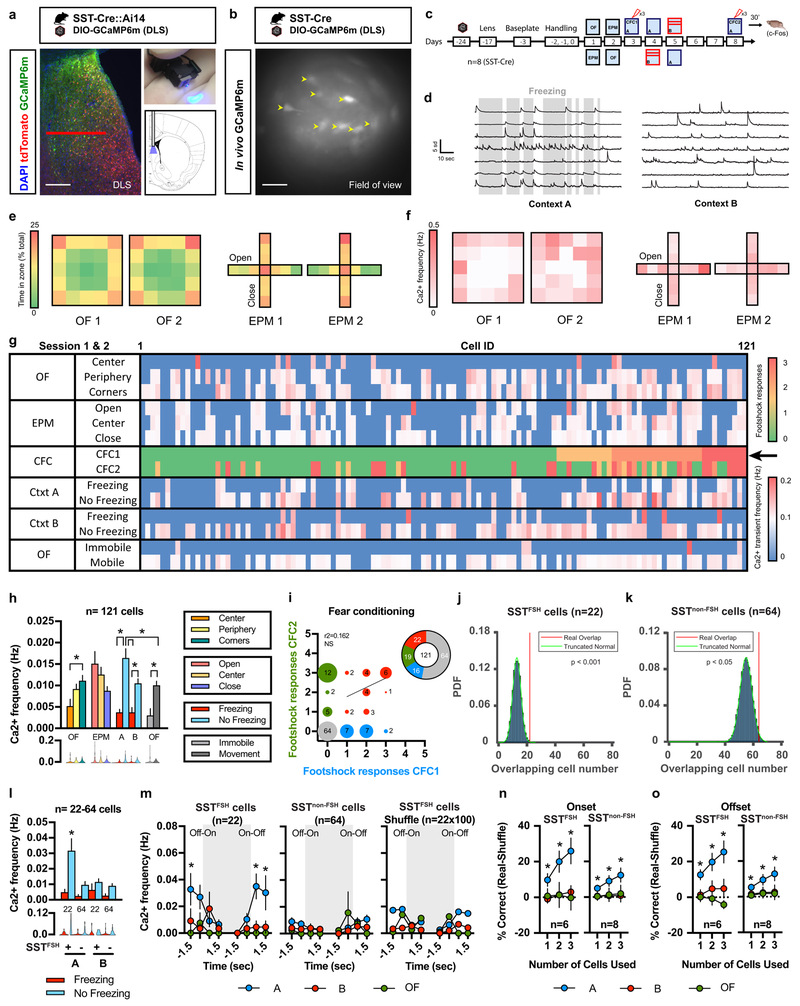
Figure 3. A stable subpopulation of SST-INs is recruited during fear conditioning and predicts freezing behavior during recall.
a) GFP Immunohistochemistry (GCaMP6m) and tdTomato expression in SST-Cre::Ai14 bigenic mice. Nuclei are counterstained with DAPI. Scale bar: 200 μm. Red horizontal bar indicates field of view. b) Field of view for in vivo GCaMP6m signal restricted to SST-INs in DLS. Representative image for 8 independent animals. Yellow arrowheads indicate representative cells with observable variations of fluorescence across time (maximum projection). Scale bar: 100 μm. c) Timeline of longitudinal calcium imaging experiments. d) Example of calcium transients detected with CNMF-E from 7 different cells during exposure to context A and context B during freezing (grey bars) and non-freezing epochs (representative of 8 independent animals). Note the limited number of transients during freezing epochs. Scale bar: x axis:10 sec, y axis:5 sd. e) Heat maps indicate the percent time (% total) spent in the different zones of the OF and EPM on two consecutive sessions. f) Heat maps indicate the calcium transient frequency (Hz) for 121 cells detected with CNMF-E per zone in the OF and EPM on two consecutive sessions. g) Raster plot of calcium transient frequency (Hz) detected with CNMF-E (average of session 1 and 2) in OF and EPM during freezing and non-freezing epochs in context A and B. Sorting of 121 cells based on their responsiveness to the first 3 footshocks administered during CFC1 (black arrow). h) Average calcium transient frequency (Hz) for the overall population (n=121 cells) identified with CNMF-E in the OF, EPM, context A and context B (average of two consecutive sessions). Means ± SEM and data distribution represented as violin plots; n= 121 cells, one-way ANOVA (repeated measures over time) followed by Tukey’s multiple comparisons post-hoc test. *p < 0.05. i) Sorting of the 121 cells detected with CNMF-E based on calcium transients observed in response to footshocks delivered during CFC1 and CFC2. Cells that never responded to footshocks (grey), cells that responded to 1, 2 or 3 footshocks during CFC1 (blue) and CFC2 (green). Cells that responded to footshocks during both CFC1 and CFC2 (red). j-k) Probability density function (PDF) for overlap between SSTFSH cells (22/121) and SSTnon-FSH cells (64/121) detected with CNMF-E across CFC1 and CFC2 with a truncated null distribution l) Average calcium transient frequency (Hz) for SSTFSH cells and SSTnon-FSH cells during freezing (red) and no freezing (blue) events in context A and context B. Means ± SEM and data distribution represented as violin plots; n= 22,64 cells, one-way ANOVA followed by Tukey’s multiple comparisons post-hoc test across no freezing events, *p < 0.05, FSH+ cells in A versus all groups. m) Calcium transient frequency analysis for behavioral state transitions for SSTFSH cells, SSTnon-FSH cells or a randomly assigned cell population of equivalent size to that of SSTFSH cells. Behavioral state transitions consist in the onset (Off-On) and offset (On-Off) of freezing bouts (grey area) in context A or B as well as immobility bouts in the open field (grey area). Means ± SEM; n= 22, 64, 100 cells per group, mixed factor two-way ANOVA (repeated measure over time) followed by Bonferroni’s multiple comparisons post-hoc test across contexts, *p < 0.05, Ca2+ frequency in A versus all groups. n-o) Decoder analysis across mice based on calcium transient frequency local minima (n) and local maxima (o) predicting behavioral state transitions (freezing or immobility) in context A (blue), context B (red) or OF (green) using 1, 2 or 3 SSTFSH cells or SSTnon-FSH cells per mouse. Means ± SEM; n= 6,8 mice per group, mixed factor two-way ANOVA (repeated measure over time) as well as one sample Student two-tailed T-test, *p < 0.05, data point versus chance. All statistics detailed in Supplementary Table 1.

