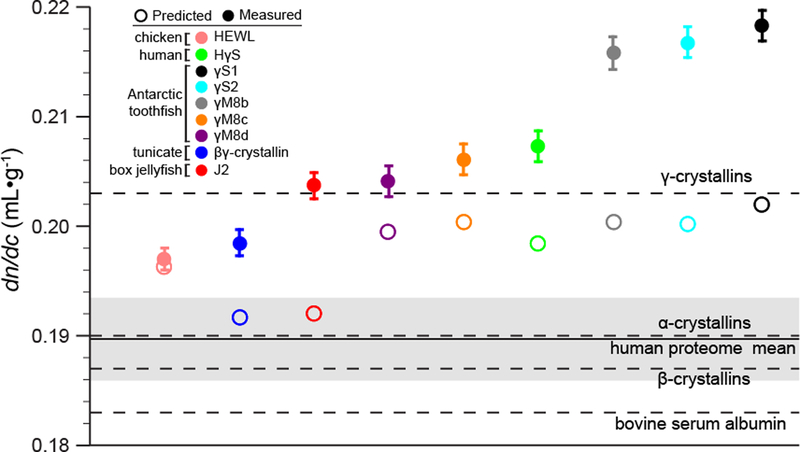
Figure 2.
Measured dn/dc values compared to predicted. The dn/dc of HEWL, human γS-crystallin, toothfish γS1-, γS2-, γM8b-, γM8c-, and γM8d-crystallins, box jelly J2-crystallin and tunicate βγ-crystallin were measured and compared to their predicted values, represented by filled and open circles respectively. The solid line represents the mean dn/dc of the human proteome, with the shaded region representing one standard deviation from the mean. The dashed lines indicate the literature dn/dc values for bovine serum albumin [39], and α-, β, and γ-crystallin fractions from bovine eye lens [19].

