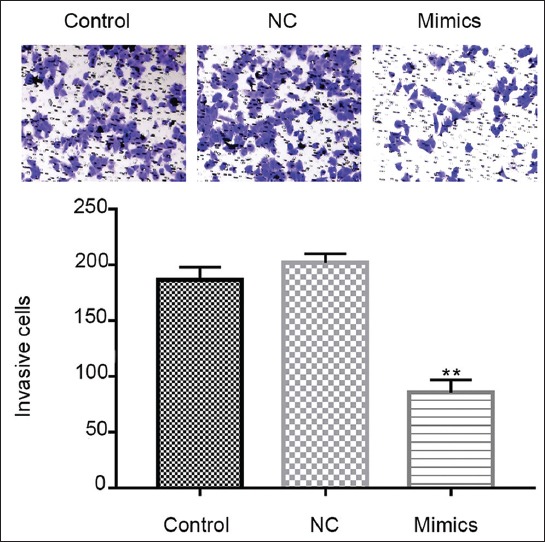
FIGURE 4.

Inhibited cell migration and invasion of MDA-MB-231 after miR-361-5p mimics transfection. Transwell assay of MDA-MB-231 and the number of invasion cells. Control: Blank group. Negative control (NC) group: Cells treated with control plasmids. Mimics group: Cells treated with miR-361-5p mimics plasmids. **p < 0.01 vs. NC group.
