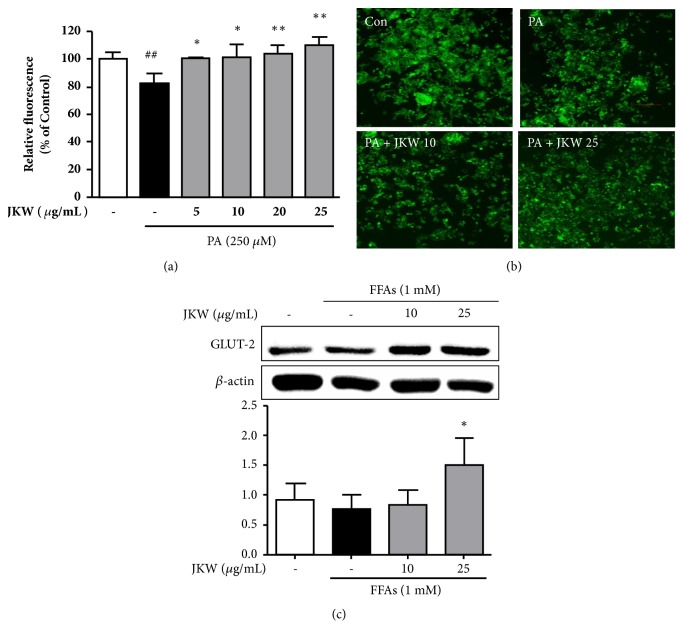
Figure 2.
Effects of JKW on glucose metabolism in HepG2 cells. (a) After 24 h of starvation, cells were cotreated with palmitate (250 μM) and JKW (5, 10, 20, or 25 μg/mL) for 24 h. Glucose uptakes were assessed based on the amount of 2-NBDG absorbed by cells as determined by measuring relative fluorescence intensities. (b) Fluorescence images were obtained by fluorescence microscopy. (c) GLUT-2 levels were assessed by Western blot and results are quoted as relative protein expressions normalized versus β-actin, which was used as a loading control. Results are the means ± SDs of three independent experiments. ##p < 0.01 vs. untreated controls. ∗p < 0.05 and ∗∗p < 0.01 versus FFA-treated controls.

