
Figure 2.
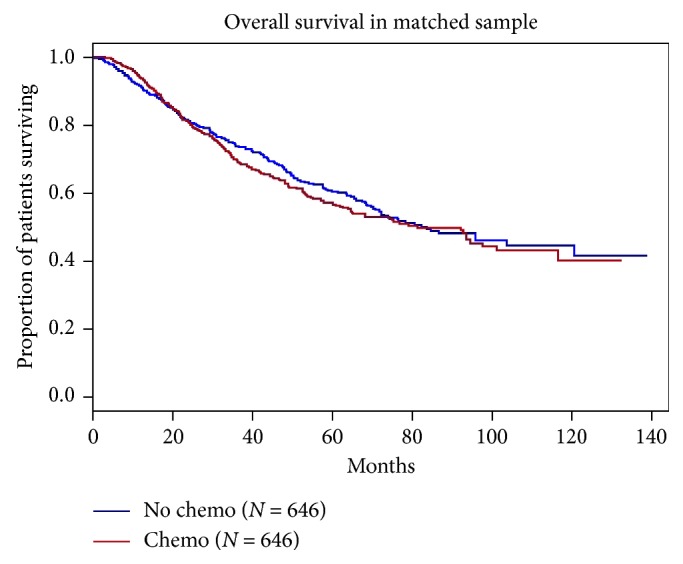
Kaplan–Meier curves of OS based on receipt of chemotherapy. The x-axis indicates the survival in months from the date of diagnosis until death or loss to follow-up. The y-axis indicates the proportion of patients surviving.
Official websites use .gov
A
.gov website belongs to an official
government organization in the United States.
Secure .gov websites use HTTPS
A lock (
) or https:// means you've safely
connected to the .gov website. Share sensitive
information only on official, secure websites.
Kaplan–Meier curves of OS based on receipt of chemotherapy. The x-axis indicates the survival in months from the date of diagnosis until death or loss to follow-up. The y-axis indicates the proportion of patients surviving.