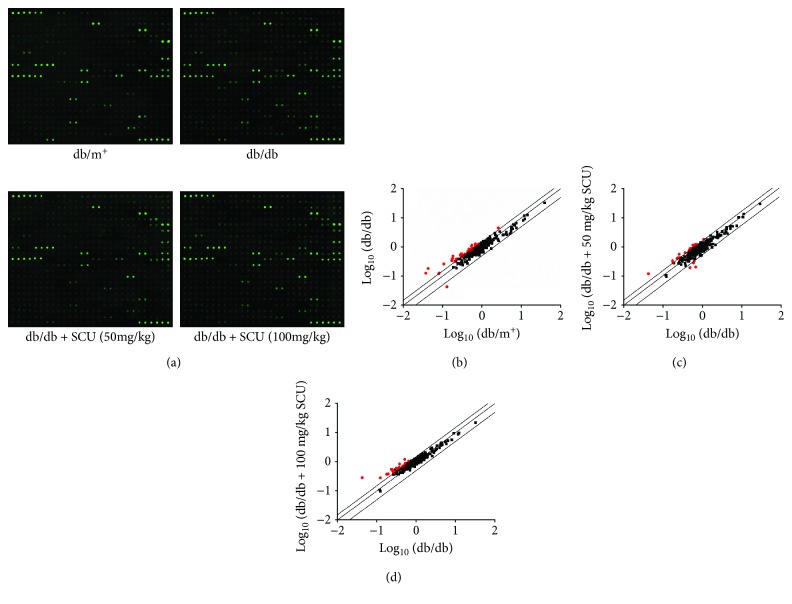
Figure 4.
The effects of SCU on the 308 cytokines in kidney of db/db mice were detected by the Mouse Cytokine Array Kit (n = 3). (a) The fluorescent graphical representation of cytokine expressions. (b, c and d) Scatter diagram of the 308 cytokines. The relative density is the ratio of the absolute value and the reference spot value. The red dots indicate the factors with a change of >50% (db/db mice vs. db/m+ mice and SCU-treated db/db mice vs. vehicle-treated-db/db mice).

