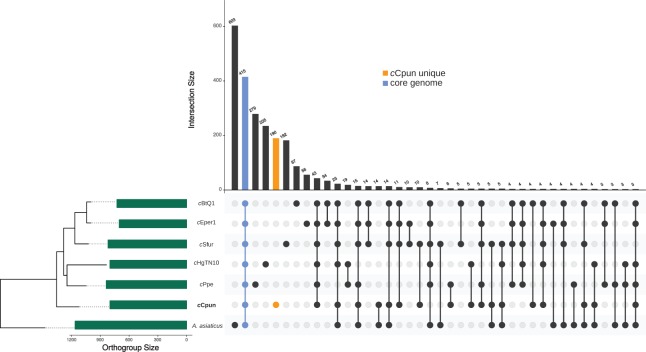
Figure 2. Genome content comparison across the seven Amoebophilaceae genomes.
UpSet plot showing unique and overlapping protein ortholog clusters across the seven Amoebophilaceae genomes cCpun, cEper1, cBtQ1, cSfur, cHgTN10, cPpe, and Amoebophilus asiaticus. The intersection matrix is sorted in descending order. Green bars represent the orthogroup size for each genome ordered by their phylogenetic relationships. Connected dots represent intersections of overlapping orthogroups while vertical bars shows the size of each intersection. The core orthogroup and the cCpun unique orthogroup cluster are shown with the blue and the orange bars respectively. The plot was generated using UpSetR package in R (Conway et al., 2017).

