
Figure 1.
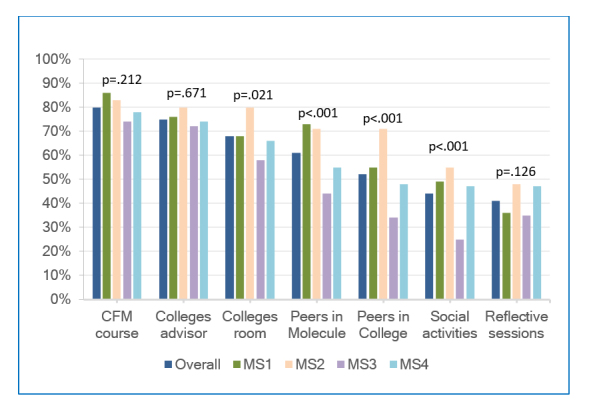
Percentages of students rating each LC component as having “exceptional” or “a lot” of value. Note: p values correspond to ANOVA tests by class year so that significant values indicate that there was a difference between values in at least two classes. CFM = Clinical Foundations of Medicine