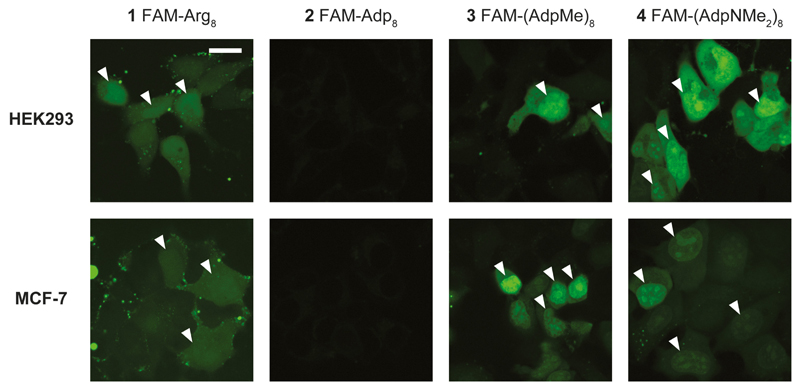
Figure 4.
Magnified view onto peptide permeability into cells and cellular compartments, respectively. Octa-Adp derivatives 3 and 4 show homogeneous cell loading accompanied by higher peptide concentrations in the nuclei (marked by white triangles). In contrast, the higher peptide concentration is hardly visible for the octa-Arg (1) (nuclei edges marked by white triangles), no permeation again for the octa-Adp derivative 2. Compound concentrations were identical to those given in Figure 3. Scale bar: 20 μm.

