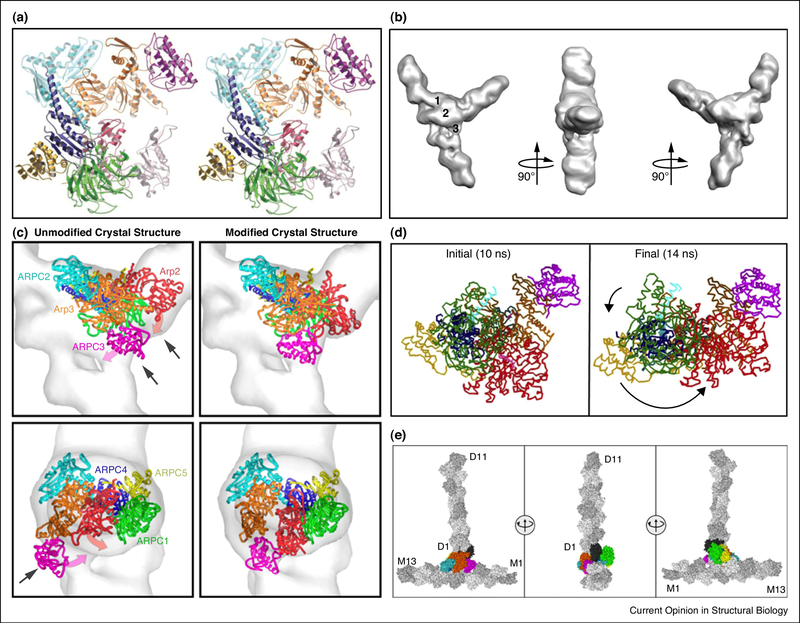
Figure 2. Structure and dynamics of the Arp2/3-actin complex.
(a) X-ray crystal structure of the inactive Arp2/3 complex viewed as a stereopair of ribbon diagrams [66]. (b) Reconstruction of a filament branch junction formed by the A. castellanii Arp2/3 complex. Three views are related by 90° clockwise rotations. Numbers indicate three bridges of density between the two branches [69]. (c) Fits of unmodified and modified crystal structures in the reconstruction of branch junctions. The “Unmodified” structure shows the best fit of the Arp2/3 complex crystal structure. Arrows indicate mismatches with the reconstruction. The magenta and red arrows indicate the movement of ARPC3 and Arp2 upon remodeling. “Modified” shows the best fit of the remodeled Arp2/3 complex [69]. (d) Complex in the initial and final conformations during MD simulations with application of directional forces between the Cα values of subdomains 3 and 4 of Arp2 in the inactive position and the target position next to Arp3, while restraining the movements of the Cα values of Arp3 subdomains 1, 2, and 4 [70]. (e) Starting structure for the simulation of the Arp2/3 complex branch junction. Three views related by 90° clockwise rotations, with protein subunits in surface representation and with mother (M1 to M13) and daughter (D1 to D11) filaments colored gray [65]. The common color code for subunits of the Arp2/3 complex is used throughout: Arp2, red; Arp3, orange; ARPC1, green; ARPC2, cyan; ARPC3, magenta; ARPC4, blue; and ARPC5, yellow. In (e) the Arp2/3 complex subunits are colored and labeled using the common coloring scheme except for Arp2 in black.

