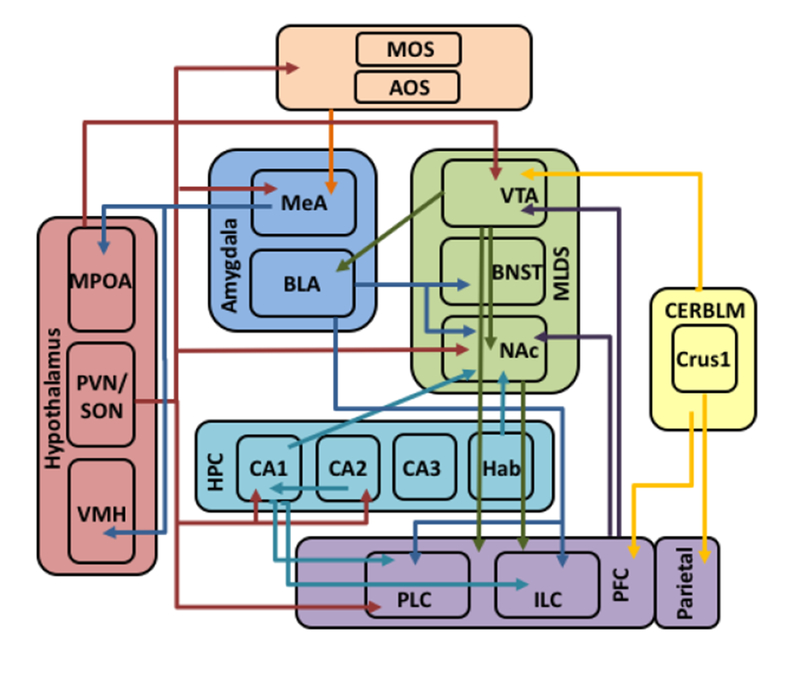
Figure 2. Map of functional connectivity within the social circuit.

Functional connectivity within the social circuit as described in the text. Arrow colors denote the brain region from which the projections originate and arrow directions denote where the projections terminate.
