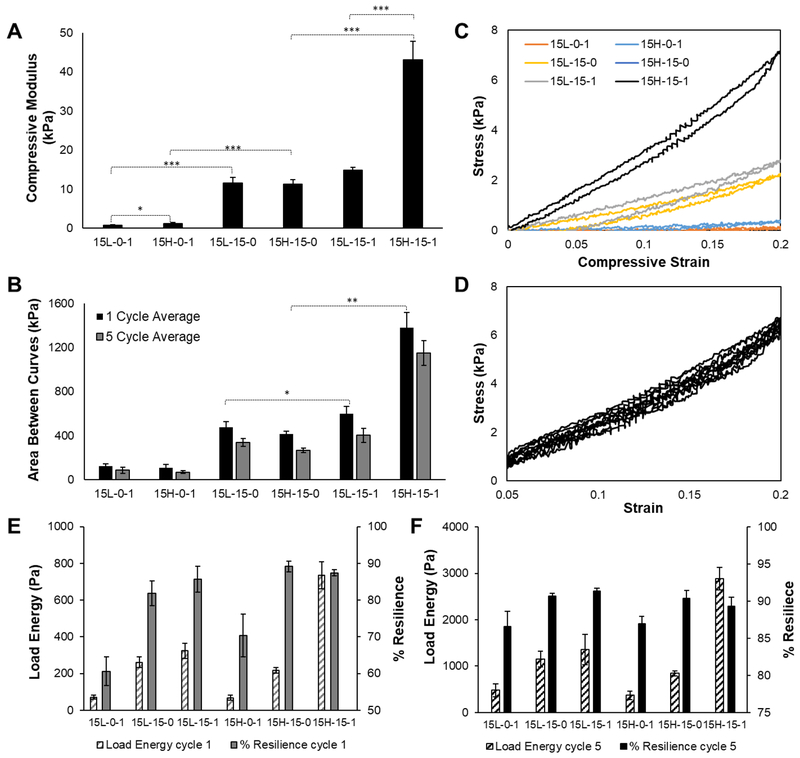
Fig. 4.
(A) 0–20% uniaxial unconfined compression tests at 10 μm/s (*** p<0.0001, * p<0.05). (B) Average area between hysteresis curves with standard deviation. This area is indicative of energy loss between loading and unloading curves (** p<0.01, * p<0.05). (C) 0–20% strain single cycle representative hysteresis curve for each material group. (C) 5–20% strain five cycle representative hysteresis curve for the 15H-15–1 material group. Dynamic data is also presented as (E) the total energy absorbed by the materials during loading and (F) the percent energy returned (i.e., % resilience) upon unloading.

