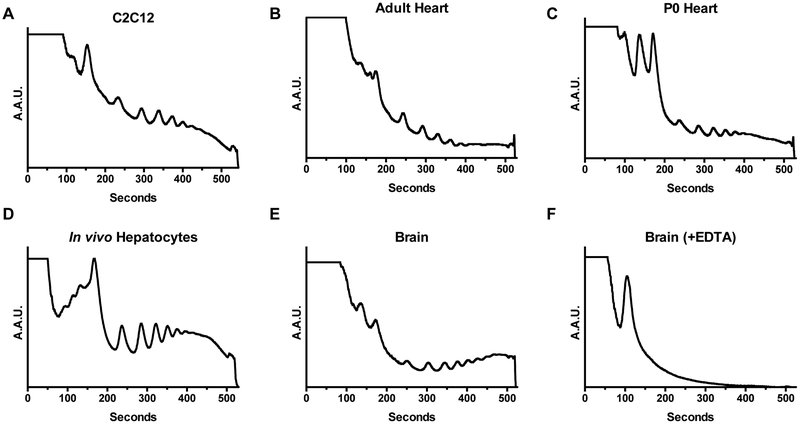
Figure 2. Polysome profiles from different cells and tissues.
Representative polysome traces measured at 254 nm of (A) undifferentiated C2C12 cells, (B) adult mouse heart, (C) neonatal mouse heart, (D) freshly isolated mouse hepatocytes, and (E) adult mouse brain. (F) A representative negative control trace in which ribosomes are disassociated from RNA by the addition of EDTA.

