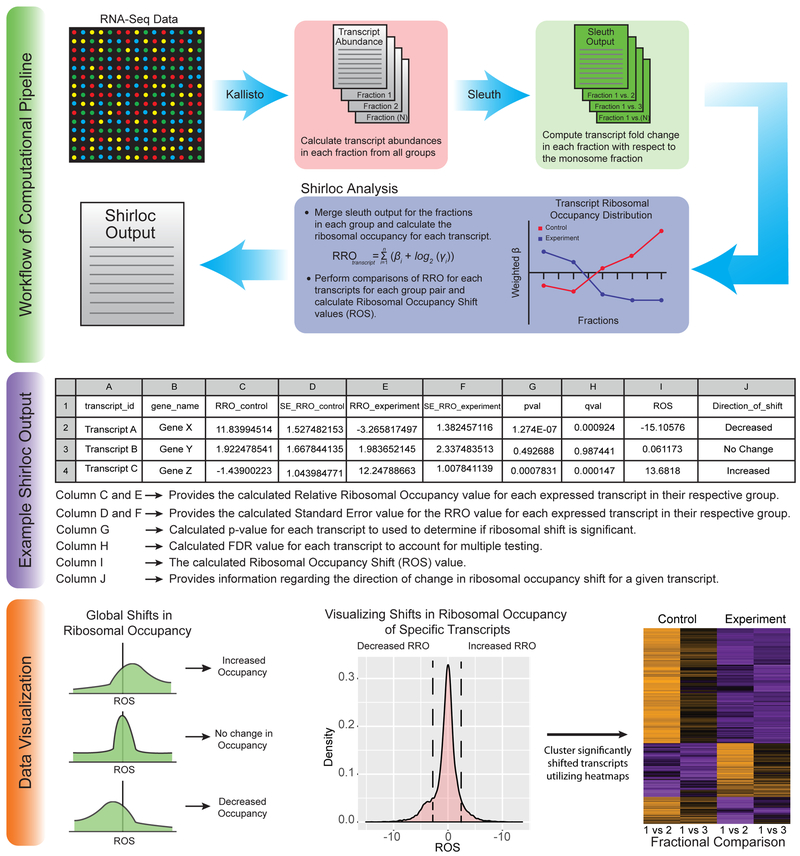
Figure 3. Shirloc bioinformatic analysis pipeline.
Shirloc utilizes Kallisto and Sleuth to determine transcript abundance and calculate fold change of fractions relative to the monosome. A ribosomal occupancy factor is then applied to calculate Ribosomal Occupancy Shift (ROS) values. The final output is given in table form. The data can then be visualized in many different ways, including the examples provided.

