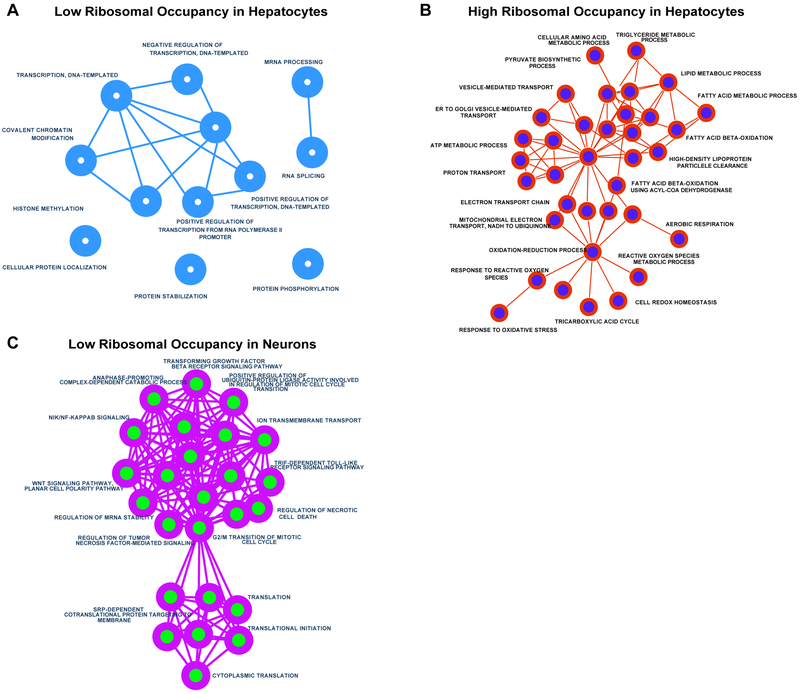
Figure 4. Gene ontology analysis of cell-type specific ribosome occupancy.
Gene Ontology networks were created using Enrichment Maps plugin for Cytoscape. Networks were generated for 1000 transcripts with the A) lowest relative ribosomal occupancy (RO) in hepatocytes, B) highest RO in hepatocytes and C) lowest RO in cultured neurons. As expected, hepatocytes showed greatest RO for transcripts involved in various metabolic functions. Cultured neurons, on the other hand revealed lowest RO cluster of processes involving translation and cell division. No significant clustering or enrichment was observed for transcripts with high RO scores.

