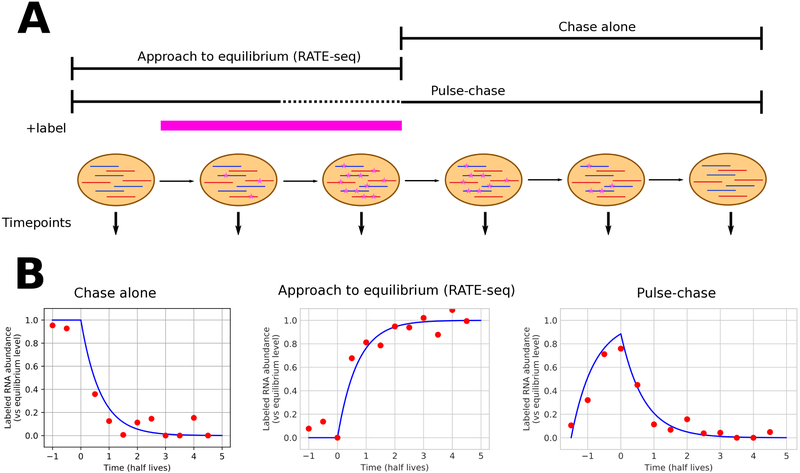
Figure 3:
Overview of different metabolic labeling time strategies, as discussed in detail in the text. A) Schematic of the timing of labeling and sample harvest for three different methods; n.b. labeling in a pulse-chase experiment is typically too short for equilibrium levels to be reached. The pink bar (+label) indicates the time period during which labeled nucleotide is present. B) Expected abundance curves (blue) and hypothetical experimental data (red) for the fractional abundance of labeled transcript for any particular RNA under each experimental procedure shown in panel A. Time is relative to a zero point at the time of labeled nucleotide removal/washout (chase-alone and pulse-chase) or addition (RATE-seq).

