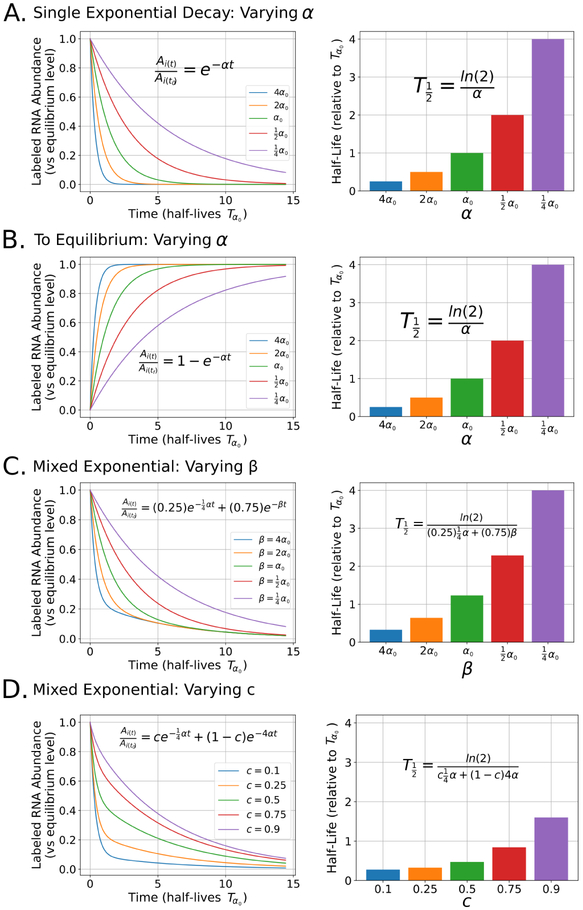
Figure 5:
Impact of varying parameters in the equations used for modeling RNA decay: For each panel, the left graph represents the shapes of several arbitrary exponential curves after perturbing a single parameter in each model. Here, the y-axis represents labeled RNA abundance relative to the equilibrium level of labeled RNA in label-containing media. The x-axis represents time in the number of half-lives for a single exponential curve with a decay rate of α0, indicated with Tα0. The right graph in each panel represents half-lives calculated from each of the curves from the corresponding left graph in the same panel and relative to Tα0. In each graph, the equation used to either model the decay or determine the half-life is displayed. A) The effect of varying α on relative RNA abundance (left) and half-life (right) when modeling RNA decay with a single exponential. B) The effect of varying α when modeling RNA decay in a to equilibrium experimental design. C) The effect of varying β with a fixed c and a fixed α when modeling RNA decay with a two component mixed exponential. D) The effect of varying c with a fixed α and β when modeling RNA decay with a two component mixed exponential.

