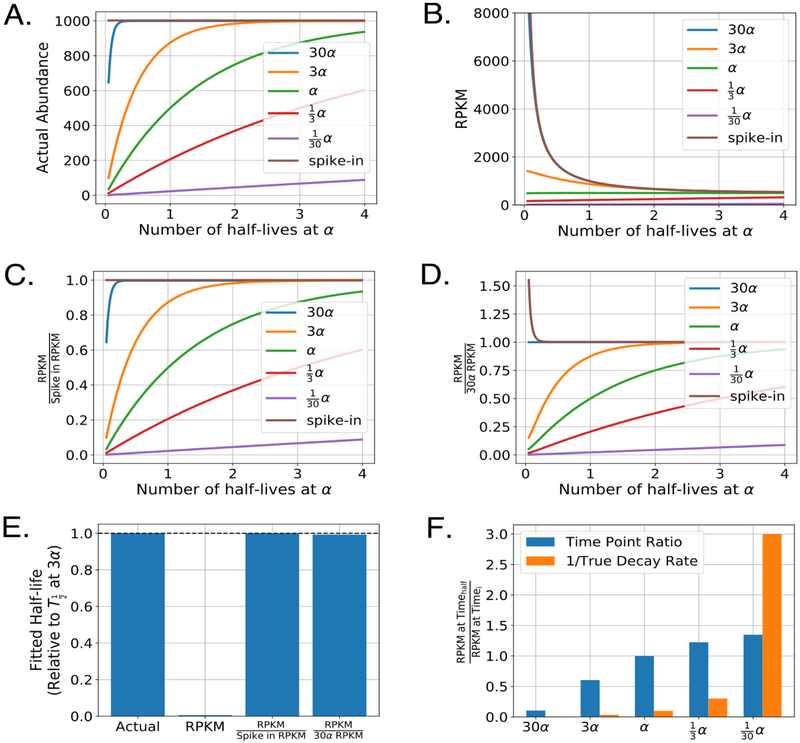
Figure 6:
Impact of common normalization procedures on the determination of RNA half-lives. A) Simulated labeled mRNA counts for several transcripts decaying at the indicated rates in an approach to equilibrium experiment. For this simulation, bulk RNA (not plotted) decayed at a rate of α and represented 99% of the total RNA sample. Spike-ins were added at 0.5% of the total RNA (that is, sum of labeled and unlabeled). B) Raw RPKM values for each transcript and spike-in RNA. For simplicity, each simulated time point was sequenced to the same depth of 5,000,000 reads and each transcript and spike-in RNA was considered to be the same exact length. Time is indicated in number of half-lives of the bulk RNA, which decays at a rate of α. C) As in B but RPKM values are normalized to the spike-in RPKM values for each sample. D) As in B-C but RPKM values are normalized to a transcript that decays at a rate of 30α. E) Calculated half-lives for the transcript with a decay rate of α. Each half-life was determined by fitting the the approach to equilibrium equation indicated in Figure 5B using non-linear least squares on five evenly spaced time points from the indicated simulated traces in panels A-D. F) Relative mRNA decay as determined by the change in raw RPKM from two time points. Timehalf was chosen to be the time point at exactly one half-life for the bulk RNA. For comparison, orange bars represent the inverse decay rate for each of the indicated transcripts.

