Figure 7:
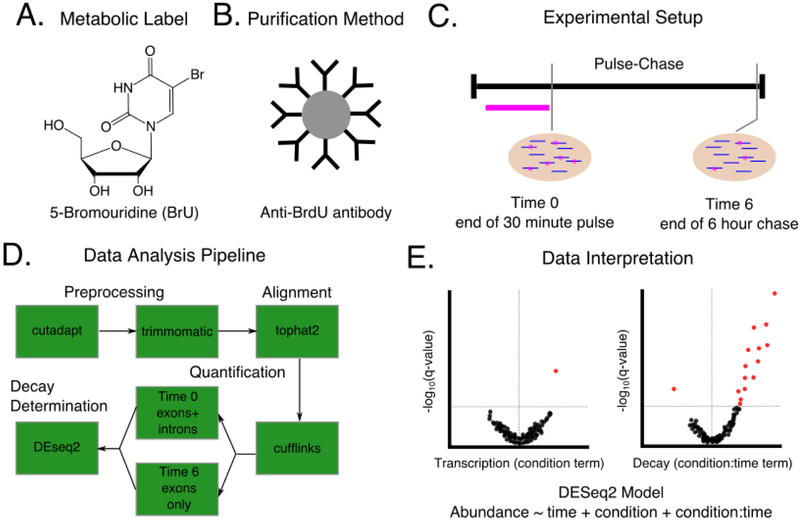
A hypothetical experimental design for determining changes in RNA decay between a WT and RBP knockdown condition. A)-C). The choices to be made in designing the experiment including which metabolic label to use (A), how to purify labeled RNA (B), and the timing of label introduction and sample harvest (C). Note that this experimental design is done in parallel for knockdown and control cells. D) A sample data analysis pipeline to be used to analyze sequencing results from the experiment described in A. Choices must be made at the preprocessing, alignment, quantification, and decay determination stages as indicated in Figure 4. E) Hypothetical volcano plots to visualize the results from the experiment in A-C as analyzed by the pipeline in D. A generalized linear model is used with DEseq2 to determine knockdown specific changes in both transcription and decay. Red dots indicate significant genes as measured by a FDR corrected p-value < 0.1. The vertical gray line in each plot indicates a log2 fold change of zero. For this hypothetical experiment, few genes had a significant change in transcription under the knockdown condition (left plot), but many genes were stabilized in the knockdown condition (right plot), suggesting that experiment identified several genes that can be considered putative targets for the RBP of interest and represent good candidates for targeted experimental follow-ups.

