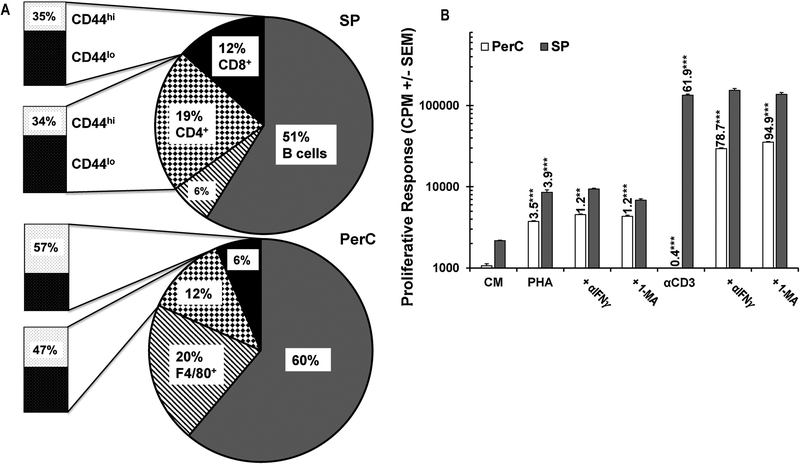
Fig. 1.
Panel A: Lymphoid composition of spleen (SP) and peritoneal cavity (PerC) cells. Mɸs defined by F4/80 and B cells by CD45R expression. Data are averages from 8–10 analyses of 8–16 wk old C57BL/6J mice. Panel B: PerC T cells respond to PHA stimulation without IFNγ neutralization or iNOS inhibition (1-MA). CM = complete media (unstimulated control). Numbers above histograms represent stimulation indices (SI) as described in Methods. Asterisks indicate significant differences in the experimental vs control conditions.

