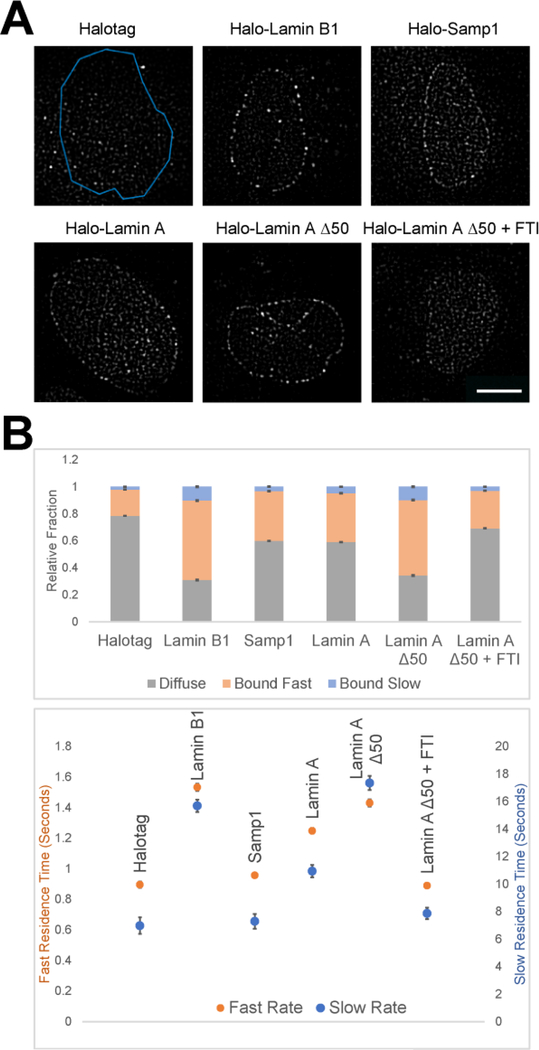
Figure 2: SMT of lamins and NETs at the nuclear periphery.
(A) Representative images after post-processing of U2OS cells transfected with Halotag alone, Halolamin B1, Samp1, lamin A, lamin A Δ50, and lamin A Δ50 treated with 1 μM farnesyltransferase inhibitor for 16 h.
(B) SMT of the cells per condition was compiled and nuclear molecule tracks were fit to a biexponential distribution. Quantification of molecule tracks indicates the ratio of identified molecules that are diffuse (grey), fast bound (orange), and slow bound (blue; top) as well as the associated dwell times (bottom). Halo-tagged proteins show increased fractions of bound molecules and dwell times as compared to non-specific binding of Halotag alone. Exposure time 30 ms; acquisition time 200 ms; 900 images per cell. Values represent means and 95% confidence intervals of at least 10 cells and 2 experiments. Scale bar = 10 μm.

