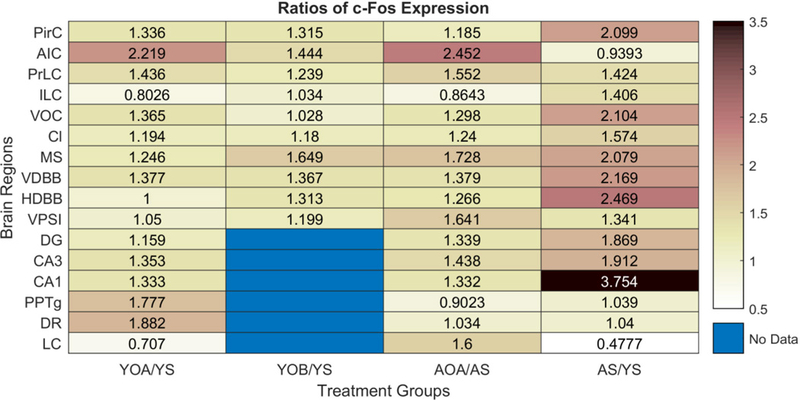
Fig. 2.

Heatmap of c-Fos expression ratios between treatment groups and age compared to young saline treated animals. The treatment groups represented in the heat map are as follows: 1) YOA/YS (YOA and YS, n=8 rats), 2) YOB/YS (YOB and YS, n=7 rats), 3) AOA/AS (AOA and AS, n=8 rats), and 4) AS/YS (AS, n=8 rats; YS, n=15 rats). The YOA/YS and AOA/AS treatment comparisons largely showed similar patterns of c-Fos expression ratios. On average, the effects of OxA treatment in aged animals were more robust than the OxA treatment in young animals. Aged animals also exhibited higher ‘basal’ c-Fos expression in most brain regions compared to young animals, as indicated by the AS/YS treatment comparison. When comparing the effects between the OxA and [Ala11,D-Leu15]-OxB treatments (i.e. YOA/YS vs. YOB/YS), the YOA/YS group shows higher c-Fos expression ratios in most brain regions. Abbreviations: YOA/YS, young-orexin-A vs. young saline; YOB/YS, young-[Ala11,D-Leu15]-orexin-B vs. young saline; AOA/AS, aged-orexin-A vs aged saline; AS/YS, aged saline vs. young saline; OxA, orexin-A; [Ala11,D-Leu15]-OxB, [Ala11,D-Leu15]-orexin-B; PirC, piriform cortex; AIC, agranular insular cortex; PrLC, prelimbic cortex; ILC, infralimbic cortex; VOC, ventral orbital cortex; Cl, claustrum; MS, medial septum; VDBB, vertical limb of the diagonal band of Broca; HDBB, horizontal limb of the diabonal band of Broca; VP/SI, ventral pallidum/substantia innominata; DG, dentate gyrus; CA3, cornu ammonis 3; CA1, cornu ammonis 1; PPTg, pedunculopontine tegmentum; DR, dorsal raphe; LC, locus coeruleus.
