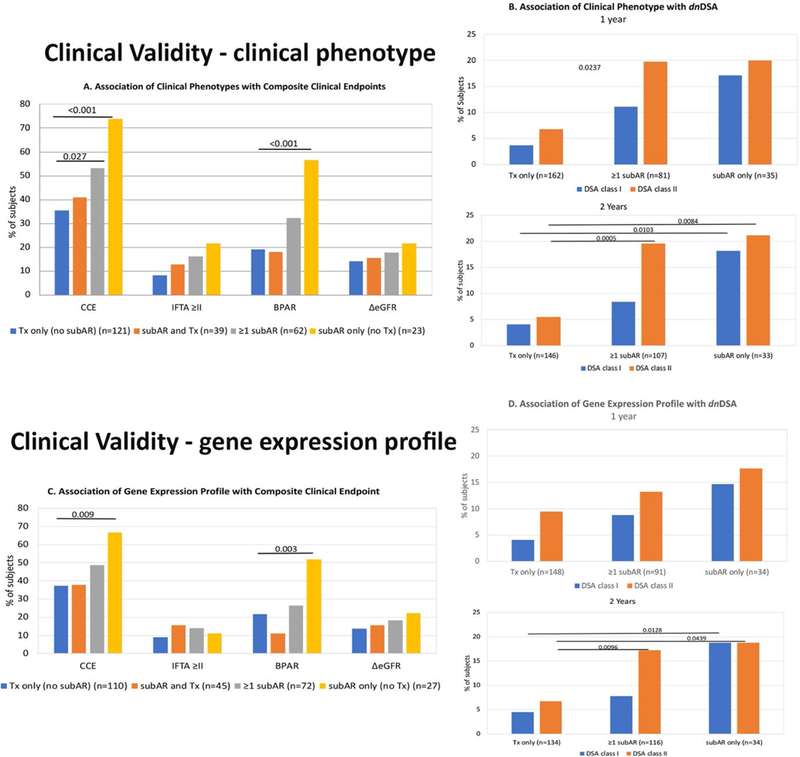
FIGURE 2.

Clinical validity is demonstrated by the clinical significance of both the clinical phenotype (CP) and the gene expression profile (GEP) of subclinical acute rejection (subAR) within the first 12 months on the composite clinical endpoint (CCE), as well as the association between the CP and GEP both within 12 and 24 months after kidney transplant (KT) and the development of de novo DSAs (dnDSAs) by the end of the study period (24 months). The data are presented according to 3 distinct groups of subjects who met the following criteria within either the first year or the study period (2 years) after KT: (1) subAR or positive biomarker only, (2) no subAR (transplant excellent [TX]) or negative biomarker only, and (3) ≥1 instance of subAR or a positive biomarker with ≥1 TX or negative biomarker. A. Association of CP with CCE. Shown are the percentage of subjects who reached an endpoint (either the CCE) or each individual component of the CCE (grade ≥2 interstitial fibrosis/tubular atrophy [IFTA] on 24-month biopsy, any episode of biopsy-proved acute rejection [BPAR], or drop in glomerular filtration rate >10 mL/min/1.73 m2 between months 4 and 24). Subjects are divided based on CP (those with only TX on biopsies [blue bars], those with either subAR or TX [orange bars], those with ≥1 episode of subAR [gray bars], and those with only subAR [yellow bars] on surveillance biopsies). B. Association of CP with dnDSAs. 1. Percentage of subjects who developed dnDSAs at any time during the study, either class I (blue bars) or class II (orange bars), based on their CP group in the 24-month trial (subjects who had TX only on biopsies, ≥1 episode of subAR on biopsy, or only subAR on surveillance biopsy). 2. Similar depiction as panel 1 for the association between dnDSAs and CPs but limited to biopsy results obtained in the first year posttransplant. C. Association of GEP with CCE. Similar to A, shown are the percentage of subjects who reached an endpoint (either CCE) or each individual component of the CCE (grade ≥2 IFTA on 24-month biopsy, any episode of BPAR, or drop in glomerular filtration rate >10 mL/min/1.73 m2 between months 4 and 24). Subjects are divided by their GEP tests results: those subjects who had only TX on GEP (blue bars), those with either subAR or TX (orange bars), those with ≥1 test with subAR (gray bars), and those who had only subAR tests (yellow bars). D. Association of GEP with dnDSAs. 1. Association between the gene GEP test and the development of dnDSAs at any time posttransplant. This includes GEP tests done within the 24-month study period. Shown are the percentage of subjects who developed dnDSAs, both class I (blue bars) and class II (orange bars) grouped based on GEP tests. The subject groups are those with only TX blood tests, ≥1 subAR blood test, or only subAR blood tests. All blood tests were paired with surveillance biopsies. 2. Similar depiction as panel 1 with the association between dnDSAs and the GEP but limited to GEP blood test results obtained in the first year posttransplant.
