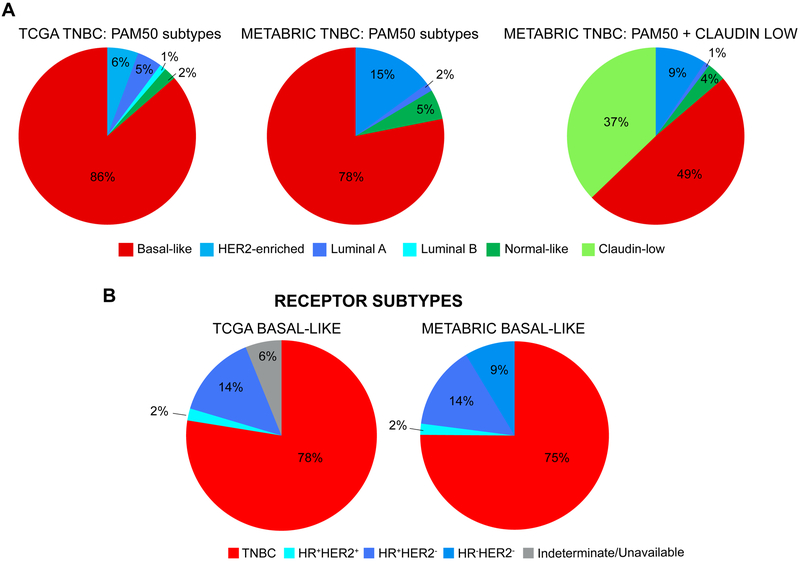
Figure 2.
Distribution of intrinsic subtypes among TNBC and distribution of TNBC among basal-like breast cancer. A, Comparison of distribution of intrinsic subtypes defined by PAM50 and PAM50+Claudin-low in TCGA and METABRIC datasets in triple-negative breast cancer (TNBC). TNBC was defined as clinical ER, PR and HER2 negative testing per IHC. In TCGA, 88 TNBC samples had available PAM50 data. The distribution of intrinsic subtypes was: basal-like (86%), HER2-enriched (6%), luminal-A (5%), luminal-B (1%), and normal-like (2%). In METABRIC, 320 TNBC samples had available intrinsic subtype data. When including claudin-low in the PAM50 predictor, the distribution of subtypes was: basal-like (49%), claudin-low (37%), HER2-enriched (9%), normal-like (4%), luminal-A (1%), and luminal-B (0%). When excluding the 119 samples with claudin-low subtype, the distribution of subtypes was: basal-like (78%), HER2-enriched (15%), normal-like (5%), luminal-A (2%), and luminal-B (0%). B, Comparison of distribution of breast cancer subtype according to receptor status defined by IHC in TCGA and METABRIC datasets in basal-like breast cancer. Of 98 basal-like breast cancers in TCGA, 78% were TNBC per IHC. Of 209 basal-like breast cancers (PAM50+Claudin-low classifier) in METABRIC, 75% were TNBC. Figures generated by re-analysis of publicly available (22,36,37) using cBioPortal (150,151).

