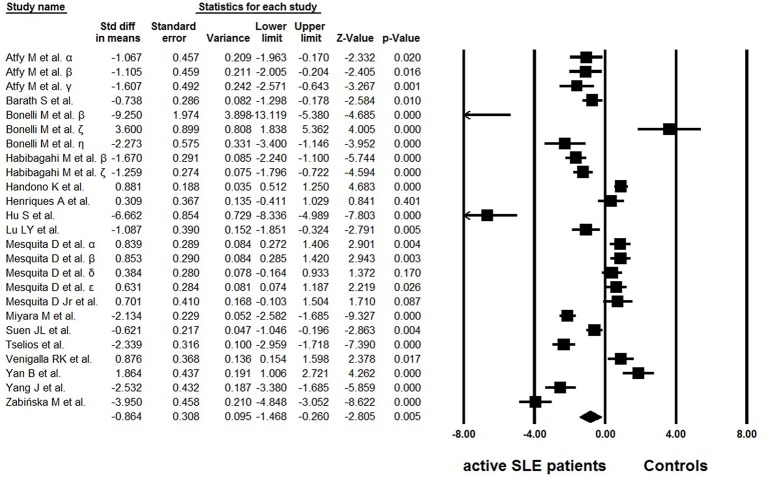
Figure 2.
Forest plot of the percentage changes of Tregs in active SLE patients compared with the controls. α: Tregs were gated by CD4+CD25+; β: Tregs were gated by CD4+CD25high; γ: Tregs were gated by CD4+CD25highFoxP3+; δ: Tregs were gated by CD25+CD127low/∅FoxP3+; ε: Tregs were gated by CD25highCD127low/∅FoxP3+; ζ: Tregs were gated by CD4+FoxP3+; η: data from Bonelli et al. (29).

