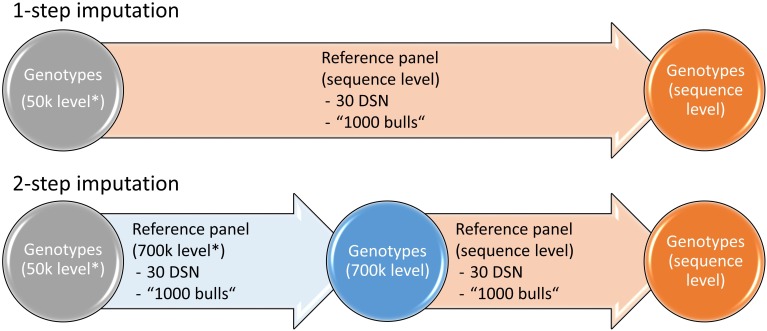
FIGURE 1.
Imputation strategies for the 1- and 2-step imputation approaches. While in the 1-step imputation the genotypes are directly imputed from 50 k to sequence level, in the 2-step imputation the genotypes are first imputed from 50 to 700 k level after which imputation is performed to sequence level. Either the 30 DSN or the “1000 bulls” reference panel were used for imputation. Genotypes that were scaled down to 50 k or 700 k level are labeled with “∗”. Similar colors refer to genotypes of the same 50 k (gray), 700 k (blue) or sequence (orange) level.

