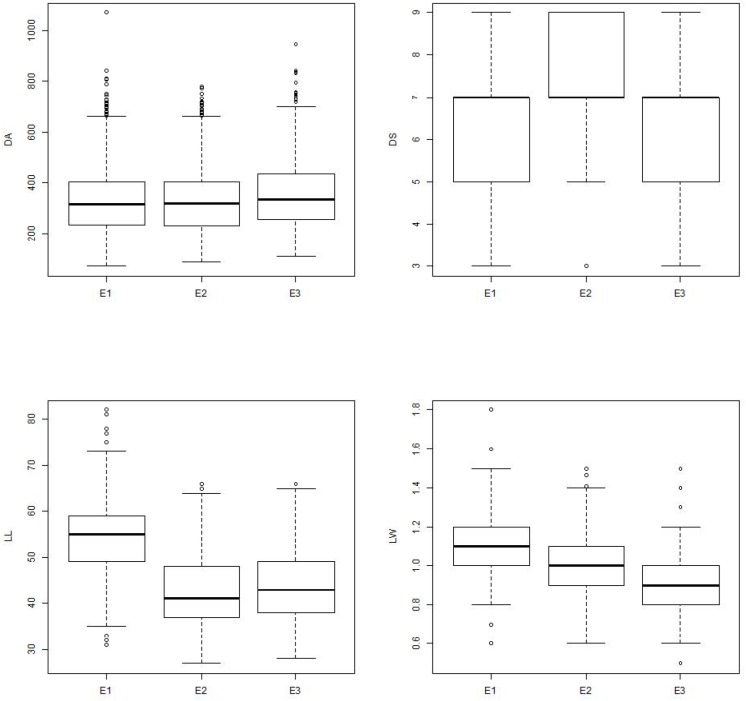
FIGURE 6.
Boxplot showing the differences in parameters among different environments. Box edges represent the upper and lower quantile with median value shown as bold line in the middle of the box. Whiskers represent 1.5 times the quantile of the data. Individuals falling outside the range of the whiskers shown as open dot. E1 = Wet season 2013; E2 = Dry season 2013–2014; E3 = Wet season 2014; DA = Damaged area; DS = Damage score; LL = Leaf length; LW = Leaf width.

