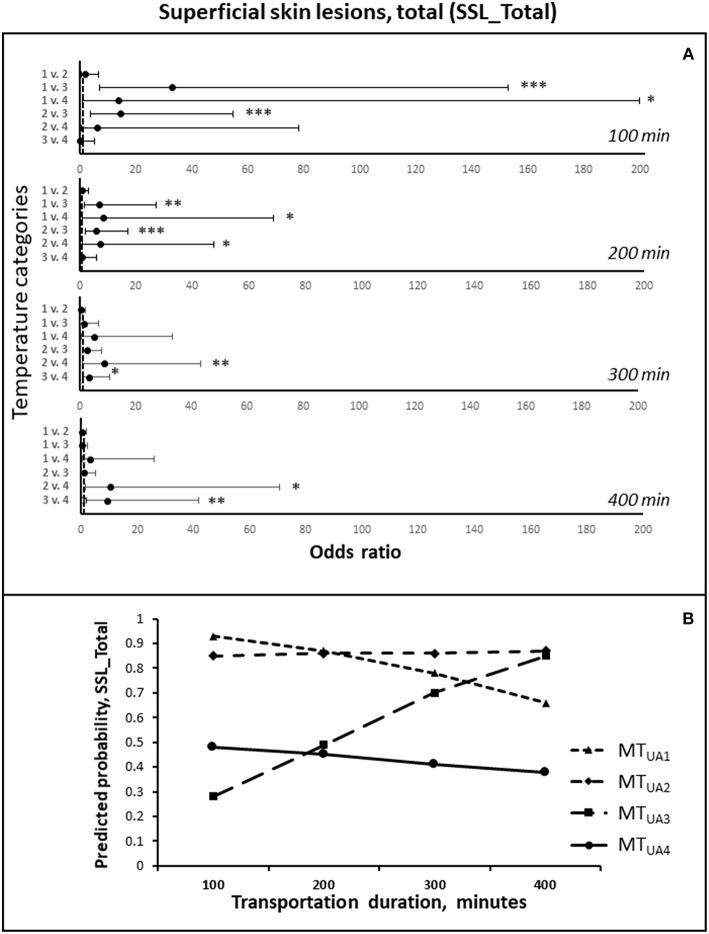
Figure 2.
(A) The odds ratios (LSMEANS and 95% confidence intervals) of getting more superficial skin lesion during transportation, in total (SSL_Total), comparing the four temperature intervals, at estimated transportation durations of 100, 200, 300, and 400 min, respectively. The odds ratios are shown on the X-axis, and the numbers 1–4 on Y-axis represent the four temperature intervals: 1 = MTUA1 (0–10°C), 2 = MTUA2 (>10–14°C), 3 = MTUA3 (>14–18.4°C), 4 = MTUA4 (>18.4°C) (Table 5). (B) The predicted probabilities of getting more SSL_Total during transportation for each of the four temperature intervals, estimated for transportation durations of 100, 200, 300, and 400 min, respectively. * P < 0.05; ** P < 0.01, *** P < 0.001.

