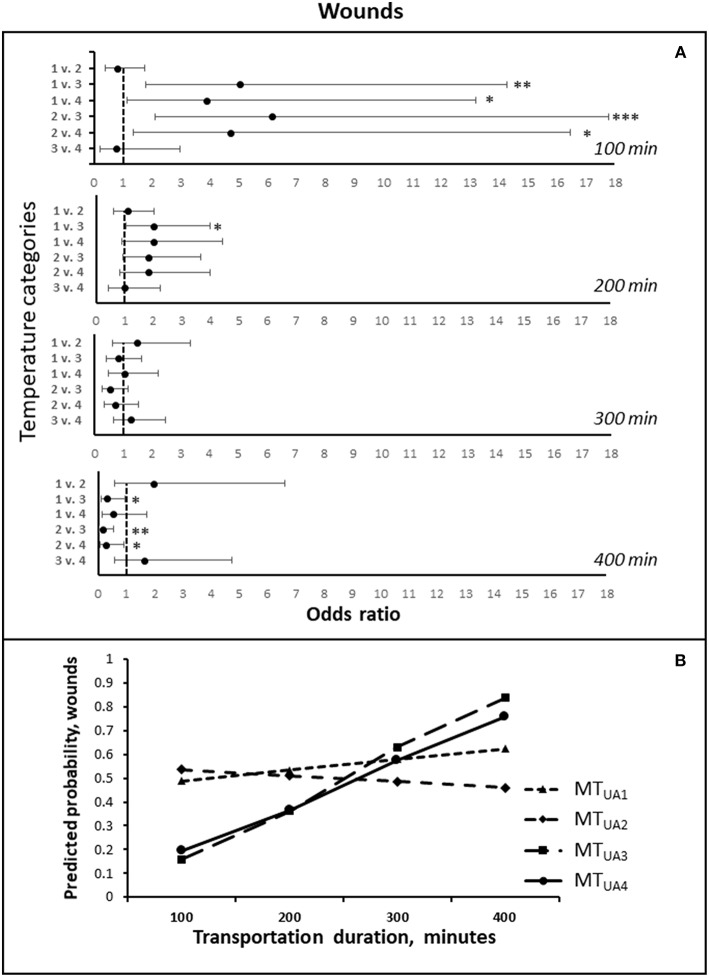
Figure 4.
(A) The odds ratios (LSMEANS and 95% confidence intervals) of getting more wounds during transportation, comparing the four temperature intervals, at estimated transportation durations of 100, 200, 300, and 400 min, respectively. The odds ratios are shown on the X-axis, and the numbers 1–4 on Y-axis represent the four temperature intervals: 1 = MTUA1 (0–10°C), 2 = MTUA2 MTUA2 (>10–14°C), 3 = MTUA3 (>14–18.4°C), 4 = MTUA4 (>18.4°C) (Table 5). (B) The predicted probabilities of getting more wounds during transportation for each of the four temperature intervals, estimated for transportation durations of 100, 200, 300, and 400 min, respectively. * P < 0.05; ** P < 0.01, *** P < 0.001.

