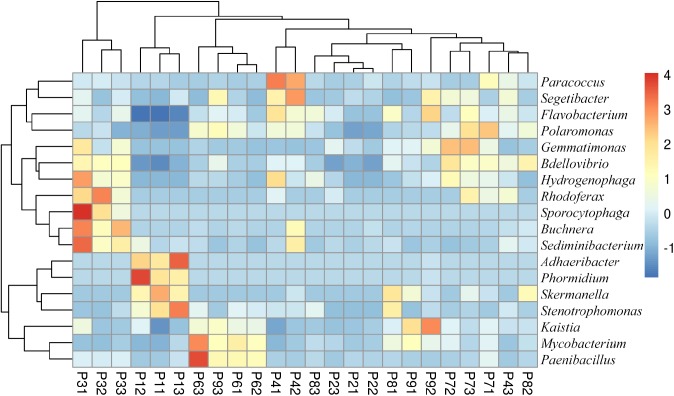
FIGURE 4.
Heatmap of bacterial genera with significant differences (p < 0.05) between samples. Relative abundance data were z-scored normalized by row. Plot was made using pheatmap R package with the default parameters. Sample names have the format Pij, where i refers to the field site (i = 1–8) and j refers to the replicate within the field (j = 1–3).

