FIGURE 5.

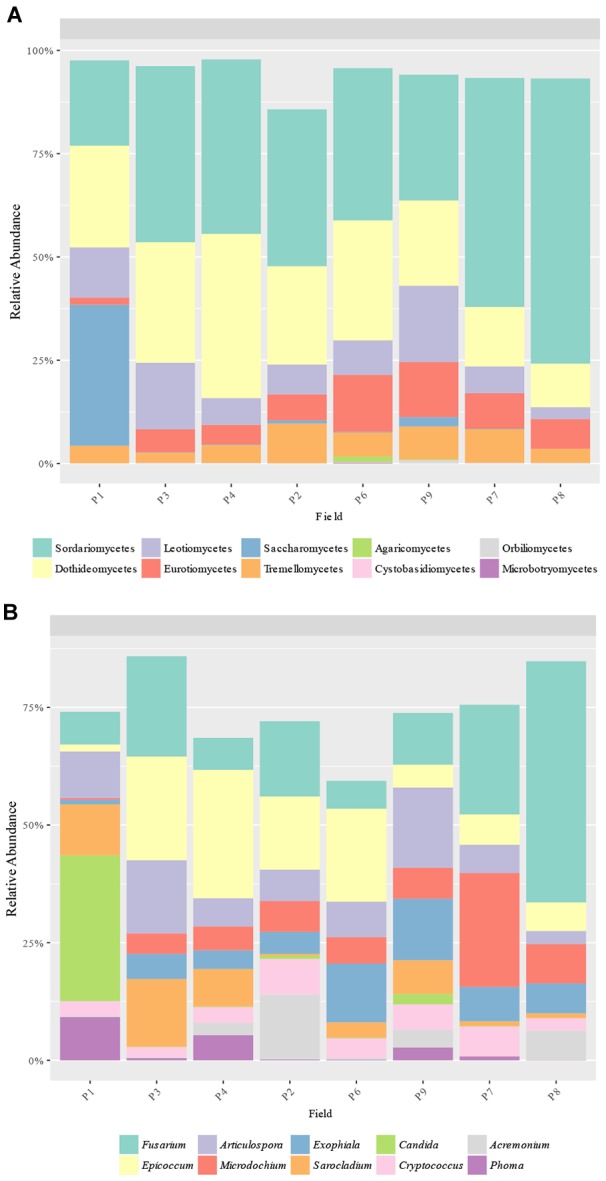
Fungal taxa distribution. Relative abundance of the predominant fungal (A) classes and (B) genera obtained by ITS amplicons.

Fungal taxa distribution. Relative abundance of the predominant fungal (A) classes and (B) genera obtained by ITS amplicons.