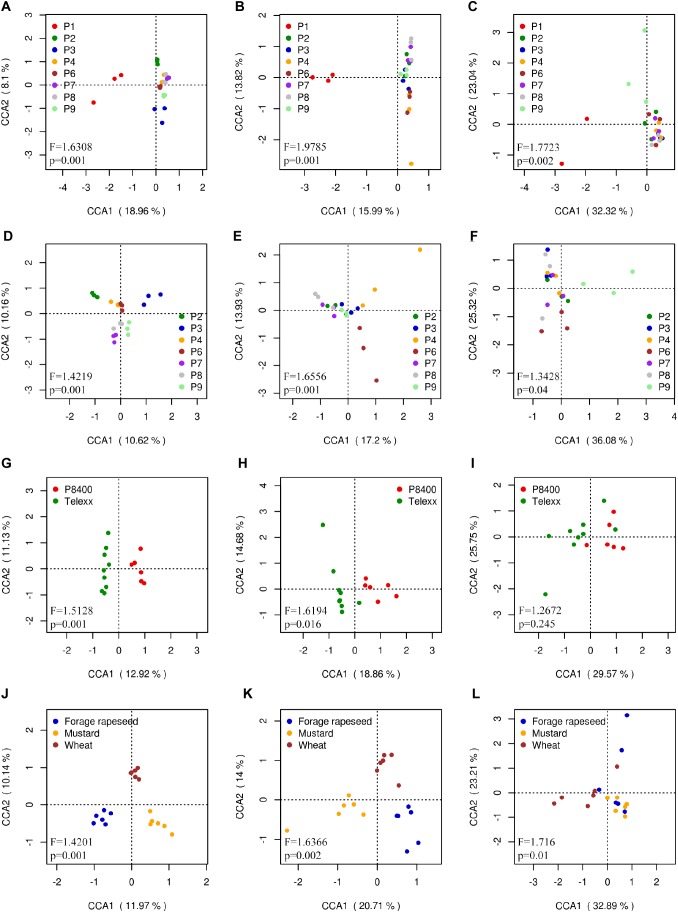
FIGURE 8.
Canonical correspondence analysis (CCA) calculated using OTUs relative abundance. Each dot represents a sample replicate for (A,D,G,J) bacterial, (B,E,H,K) fungal, and (C,F,I,L) Fusarium communities, using (A,B,C) all sites, (D,E,F) all sites except P1, (G,H,I) samples grouped by maize variety and (J,K,L) by previous crop.

