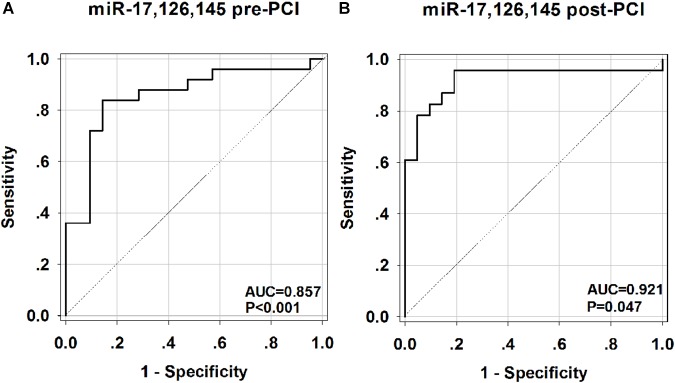
FIGURE 6.
Receiver operating characteristic (ROC) curves analysis of the combination of miR-17-5p, miR-126-5p, miR-145-3p for predicting AMI. The areas under the curves (AUC) are 0.857 (95% CI: 0.743–0.971, p < 0.001) for the combination of miR-17-5p, miR-126-5p, miR-145-3p before PCI (A) and 0.921 (95% CI: 0.829–1.014, p = 0.047) for the combination of miR-17-5p, miR-126-5p, miR-145-3p after PCI (B). CI, confidence interval.

