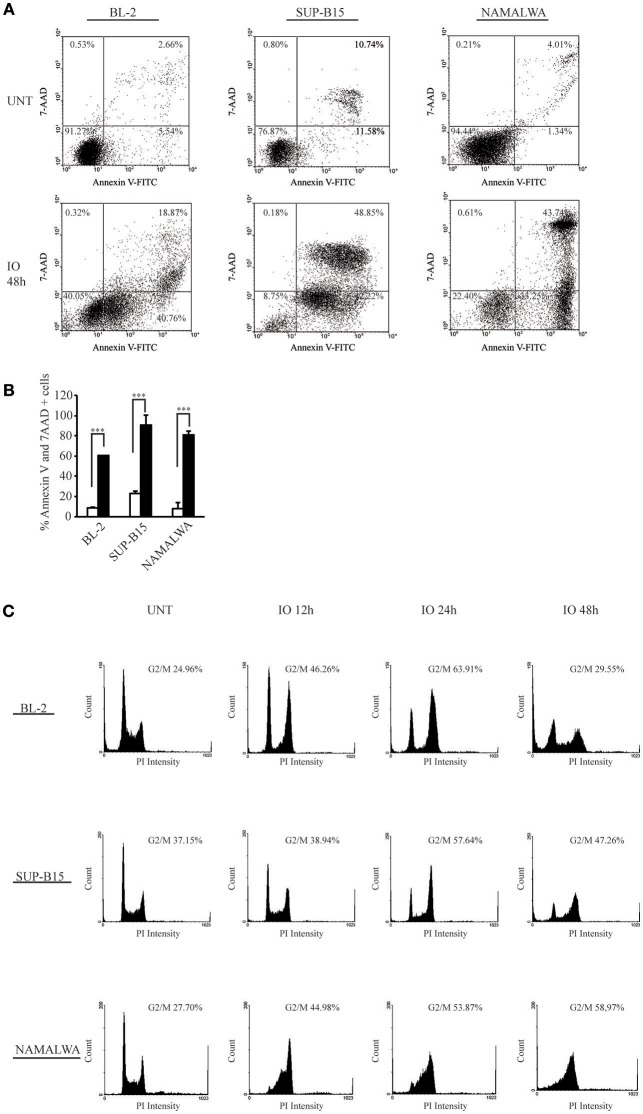
Figure 2.
CD22-expressing cells that survive Inotuzumab Ozogamicin are blocked in the G2/M phase of the cell cycle. (A) Representative dot plots showing the apoptotic rates observed in BL-2, SUP-B15 and Namalwa cells. The indicated CD22-positive cell lines were either left untreated (UNT) or treated with calicheamicin equivalents corresponding to their IO IC50 values for 48 h. Apoptotic rates were evaluated using flow cytometry after Annexin V-FITC/7AAD double staining. The indicated percentage values show the distribution of viable and necrotic/apoptotic cells for each condition. (B) Histograms representing the average percentage of Annexin V and 7 AAD positive cells in the untreated (white columns) or IO treated (with their respective IC50 values; black columns) conditions. Columns represent average ± standard deviation of three independent experiments performed in triplicates. ***p < 0.001 (C) Representative experiment displaying the cell cycle distribution of BL-2, SUP-B15 and Namalwa cells. Each line was treated for 12, 24, and 48 h with it's respective IO IC50 value and surviving cells were then analyzed for cell cycle distribution by flow cytometry using propidium iodide (PI). The percentage of cells blocked in G2/M is indicated for each panel.

