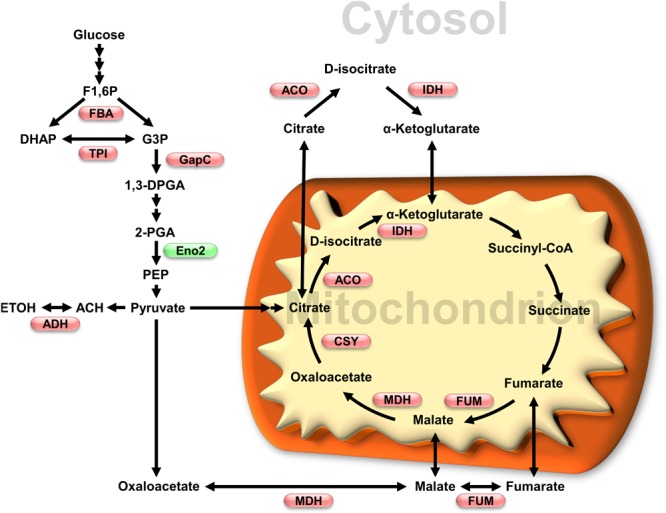
FIGURE 2.

Impact of oxidative stress on glycolytic and TCA cycles enzymes activity. Enzymes which activity has been shown to be affected by redox modification are shown in a metabolic scheme that also includes subcellular localization. Red and green, respectively, indicate inhibition and activation under oxidative conditions. Enzymes and metabolites abbreviations: FBA, fructose-1,6-bisphosphate aldolase; TPI, triosephosphate isomerase; GapC, glyceraldehyde 3-phosphate dehydrogenase; Eno2, enolase 2; ADH, alcohol dehydrogenase; ACO, aconitase; IDH, isocitrate dehydrogenase; MDH, malate dehydrogenase; FUM, fumarase; CSY, citrate synthase. Metabolites: F1,6P, fructose-1,6-bisphosphate; DHAP, dihydroxyacetone phosphate; G3P, glyceraldehyde 3-phosphate; 1,3DPGA, 1,3-bisphosphoglycerate; 2-PGA, 2-phosphoglycerate; PEP, phosphoenolpyruvate; ACH, acetaldehyde; ETOH, ethanol.
