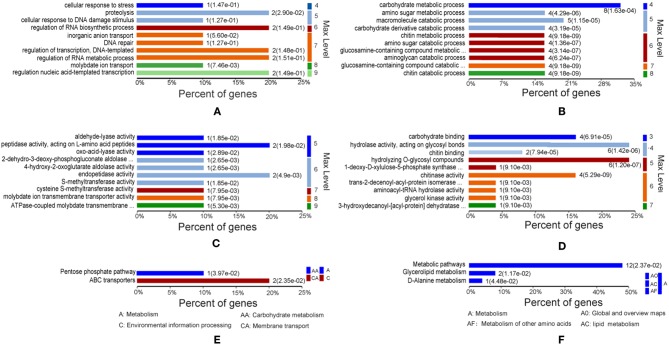
Figure 2.
Gene Ontology (GO) of differentially expressed proteins under iron starvation. (A,C,E) Upregulated proteins associated with biological processes, molecular functions, and KEGG pathways, respectively. (B,D,F) Downregulated proteins associated with biological processes, molecular functions, and KEGG pathways, respectively. The p-value cutoff was set at < 0.05. Different colors represent different GO levels, from 3 to 9.

