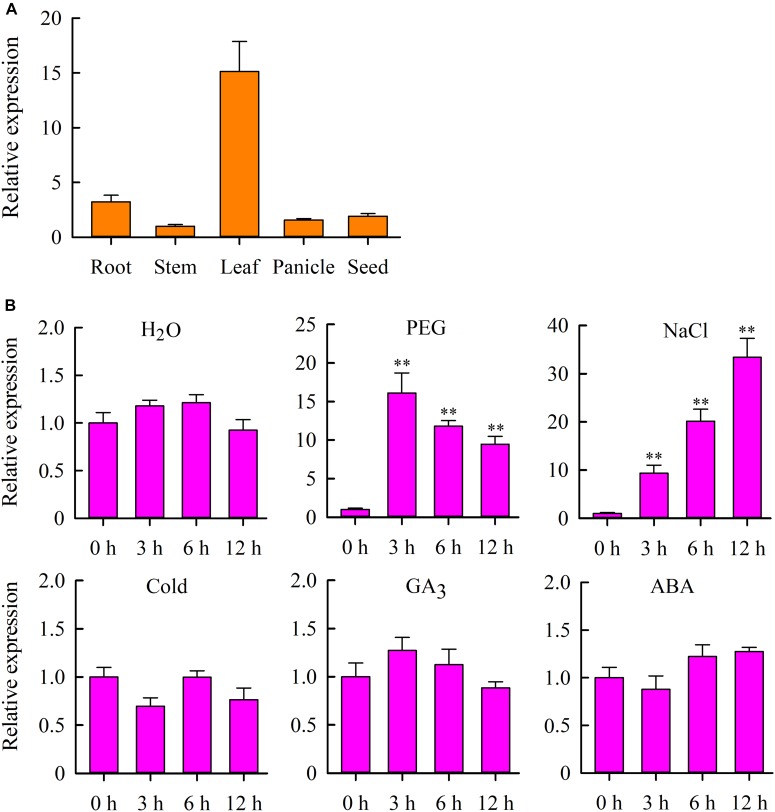
FIGURE 2.
Expression analysis of the OsMYB6 gene in rice. (A) qRT-PCR analysis of OsMYB6 gene expression in various tissues. Bars show means ± SD of three biological replicates. (B) OsMYB6 expression analysis (qRT-PCR) in leaves of 2-week-old rice seedlings subjected to H2O, 20% PEG 6000, NaCl, cold, ABA and GA3 treatments, respectively. Bars show standard deviations of the replicates. Each assay was run in triplicate for three independent biological replicates. Values represent means of n = 3 ± SD (Duncan test: ∗∗P < 0.01).

