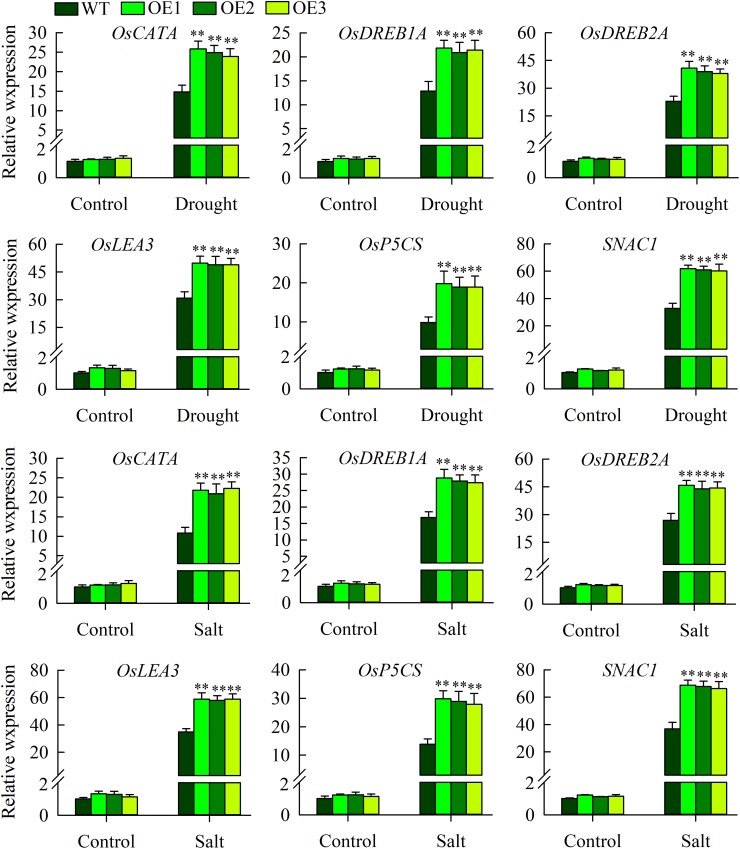
FIGURE 7.
The expression of abiotic stress-responsive genes in the wild-type and transgenic plants under normal growth, drought and salt stress conditions. The experiment included three biological replicates, each with two technical replicates. Values represent means of n = 6 ± SD, and the asterisks above the bars indicate significant differences from the corresponding WT at the p < 0.01 level.

