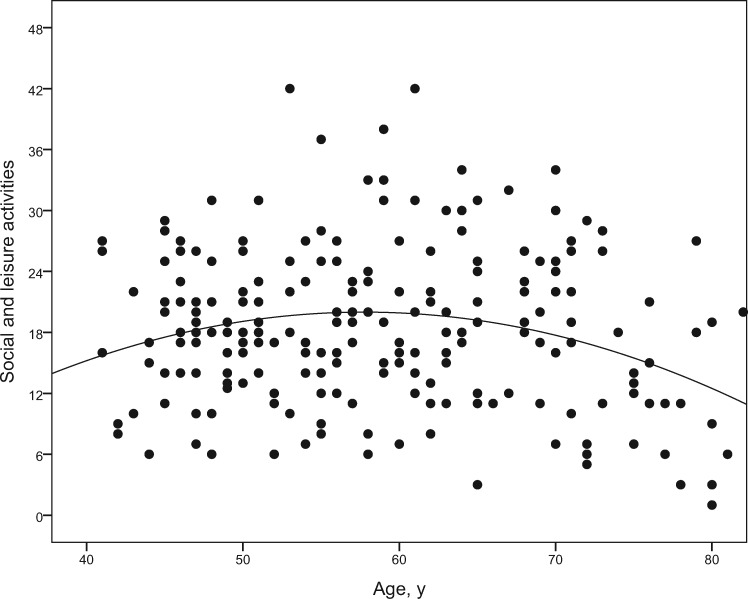
Figure 1.
Association between age and social and leisure activities. Dots represent the scores of all individuals. Higher scores indicate higher engagement in social and leisure activities (scale range from 0 to 48). The curvilinear association between age (in years) and social and leisure activities is illustrated by the curve indicating that activity engagement is highest at around age 60 years, but lower before and thereafter.

