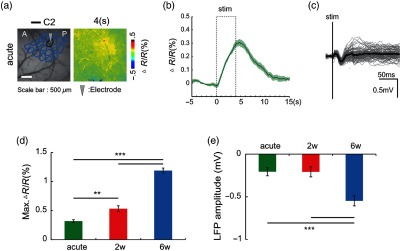
Fig. 12.
Hemodynamic change and LFP postsoft window installation. (a) Spatial activation map of ORIS imaging during single whisker stimulation. (b) Graph of change (). (c) LFP following C2 whisker single deflection (trials = 100). (d) Peak value of change (acute: , 2 weeks, 6 weeks: , value: acute versus 2 weeks = 0.003, acute versus 6 weeks, 2 weeks versus ). (e) Peak amplitude of LFP following C2 whisker single deflection (trials = 500, all ).

