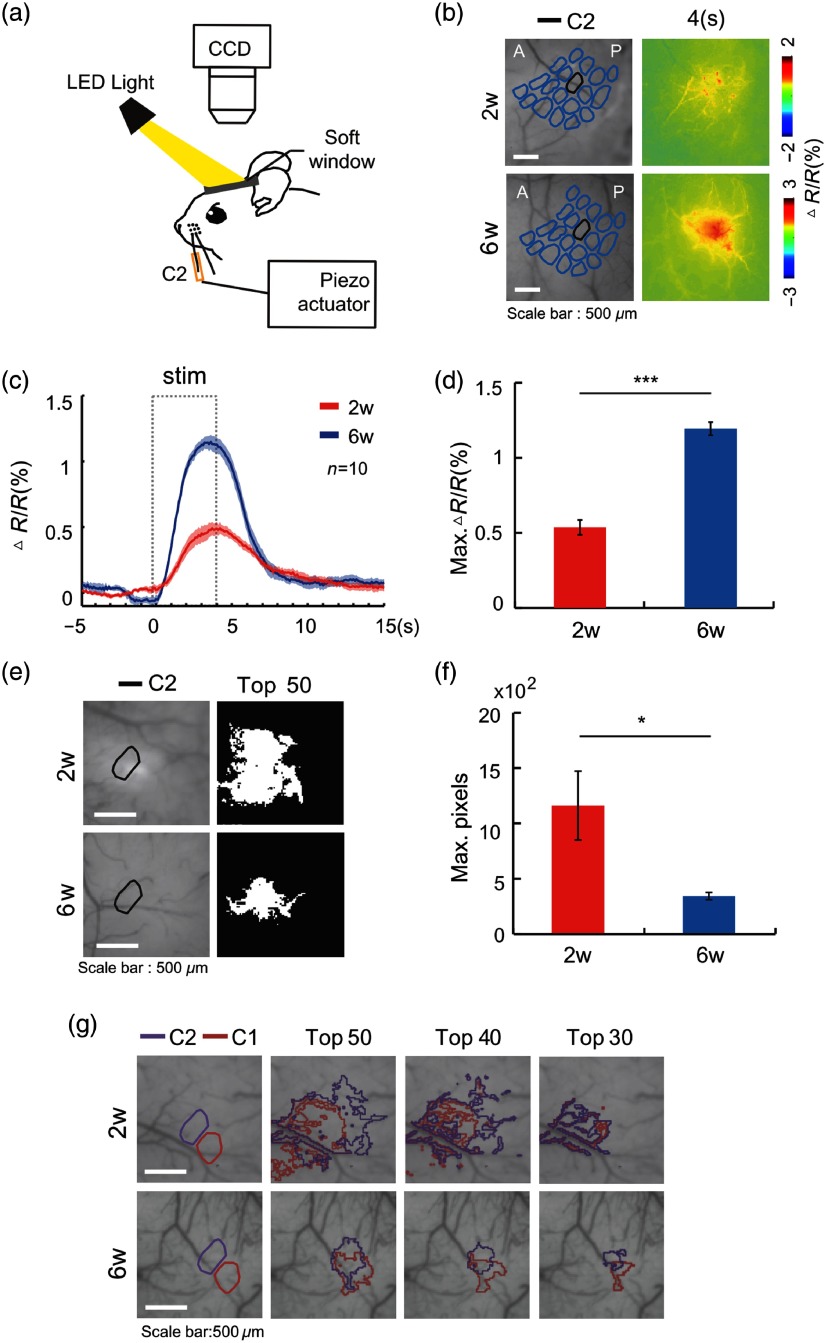
Fig. 4.
Hemodynamic change upon piezo stimulus of mice at 2 or 6 weeks postsoft cranial window implantation. (a) Optical recording of intrinsic signal (ORIS) set up with single-whisker stimulation (C2 whisker, 4 s) by piezo actuator. A 570-nm bandpass filter was used. (b) Spatial activation map of ORIS imaging for single-whisker stimulation. (c) Graph of change ( in each group). (d) Peak value of change ( in each group, ). (e) Spatial extent map of change at the activated site following piezo stimulus. The spatial extent map described the areas that have change values within 50% of the peak response value of in whole frames. (f) Pixel counts in the spatial extent maps (). (g) The spatial extent map of change of C1 and C2 whisker piezo stimulation of an animal 2 and 6 weeks postsoft cranial window installation (Top 50 = within 50% of the peak response value of , top 40 = within 40% of the peak response value of , top 30 = within 30% of the peak response value of ).

