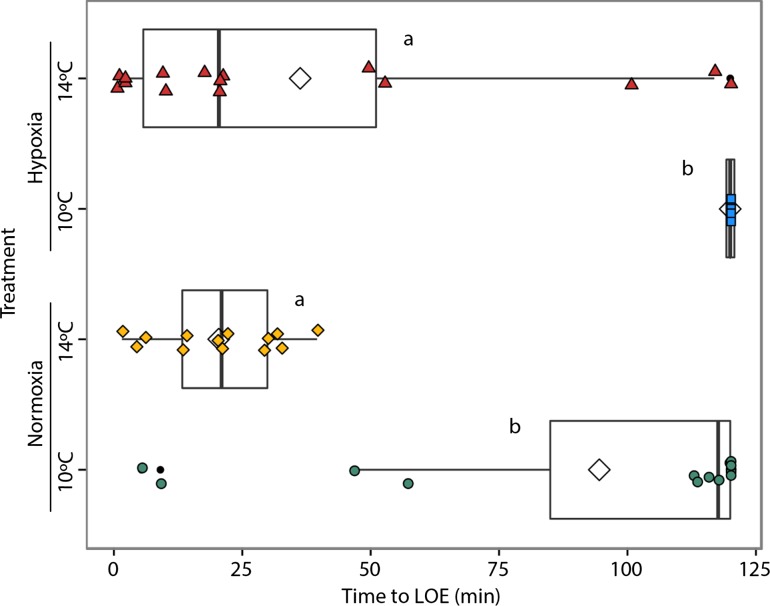
Figure 3:
Acute hypoxia tolerance of fry was measured as the time (min) until fish lost equilibrium while held at 8% dissolved oxygen saturation. A total of n = 16 individuals per treatment (10°C Normoxia [green, n = 15], 10°C Hypoxia [blue n = 16], 14°C Normoxia [yellow, n = 13] and 14°C Hypoxia [red, n = 13]) were tested. Each test was conducted at the temperature fish were reared at and began at the dissolved oxygen saturation of the corresponding treatment. The center line of the boxplots represents the median, the box represents the inter-quartile range (IQR), the whiskers extend 1.5 times IQR, black points represent values outside 1.5 the IQR, and diamonds represent the mean. Letters indicate significant (P < 0.05) differences between treatments.

