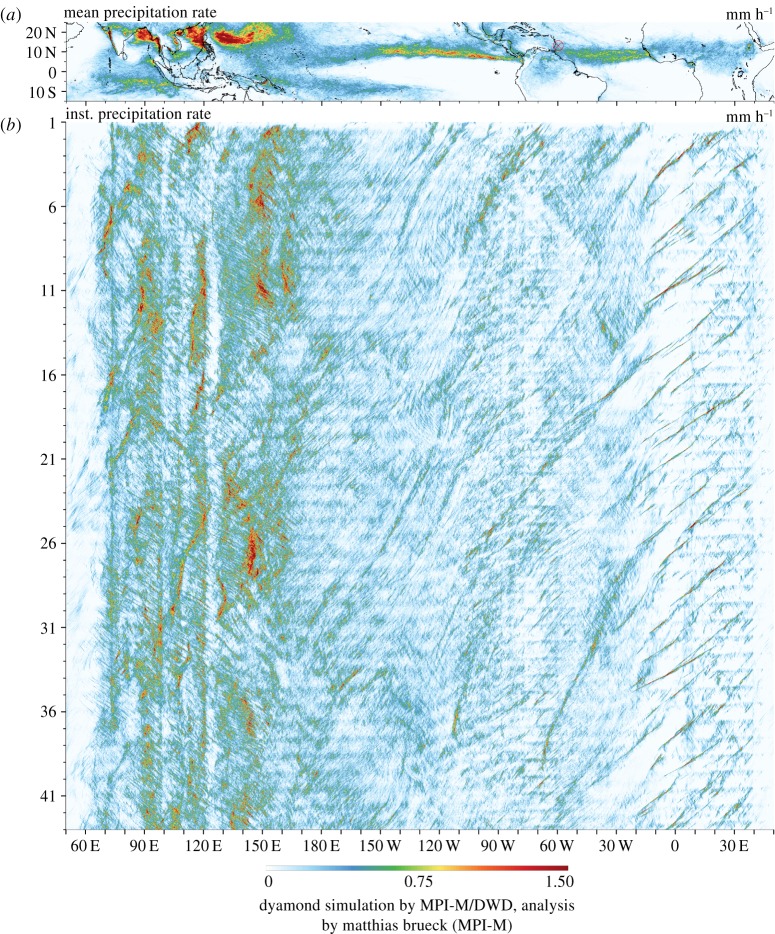
Figure 3.
Tropical precipitation resulting from explicit convection in the ICON-DYAMOND simulations. (a) Temporal mean precipitation rate. (b) Hovmoeller diagram of meridionally averaged precipitation (longitude (x), time in days (y)). The emerging dynamic character of propagating connective clusters manifests in slated lines of precipitation.

