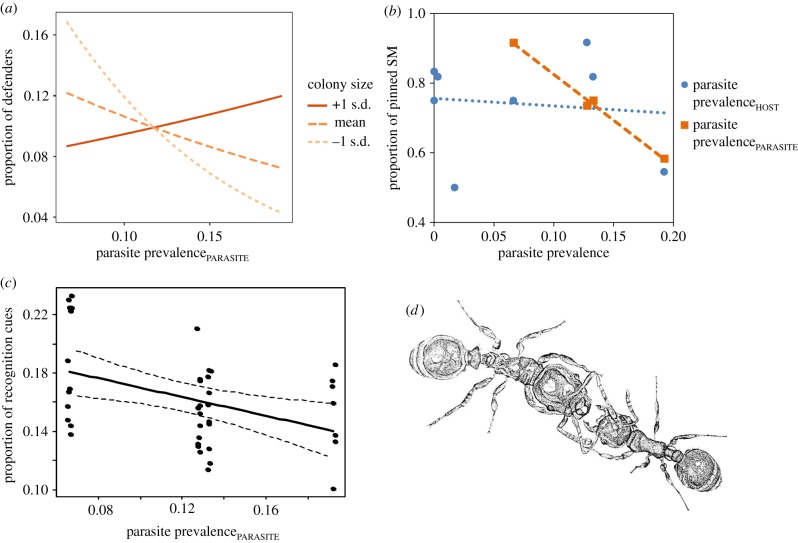
Figure 1.
(a) Proportion of host workers involved in defence against the intruding slavemaker was affected by an interaction between the success of the slavemaking population (parasite prevalencePARASITE) and host colony size. Lines represent three different colony size classes (large = mean + 1 s.d.: solid line; midsized colonies = mean: long-dashed line; small colonies = mean − 1 s.d.: short-dashed line). (b) The percentage of slavemaker intruders that were immobilized or killed by host defenders (proportion of pinned SM) depended on the success of the slavemaking population (parasite prevalencePARASITE, brown squares, dashed line), but not on parasite pressure (blue circles, dotted line). (c) Total proportion of cuticular recognition cues in T. americanus in relation to its success. Each data point (n = 40) represents the proportion of recognition cues in the CHC profile of one T. americanus worker (i.e. nine CHCs identified as relevant for nestmate recognition in T. longispinosus). The graph shows a linear regression line with 95% confidence interval. (d) T. americanus slavemaker worker (left) interacting with a smaller T. longispinosus host worker (drawing by Inon Scharf). (Online version in colour.)

