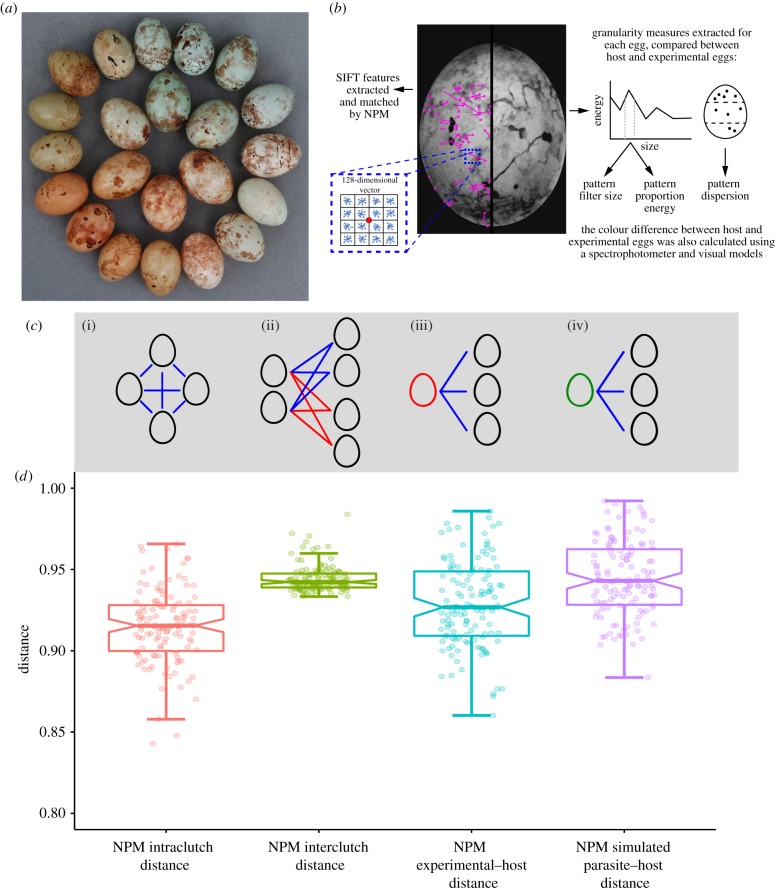
Figure 1.
(a) Eggs laid by different prinia females (outer circle) and cuckoo finch females (inner circle). Photo by CNS, previously published in [28]. (b) Illustration of feature extraction by NPM (using SIFT) and granularity analysis. Pattern dispersion is not derived from granularity analysis and is calculated separately. (c) Diagram illustrating the methods for calculating pairwise measures. From left to right: (i) Host intraclutch distance; here calculated as the average of the blue lines. (ii) Host interclutch distance; here the blue lines are averaged to find the distance between the left clutch and the top-right clutch. Following this, the red lines are averaged to find the distance between the left clutch and bottom-right clutch. The average of these two measurements is the interclutch distance of the left-hand clutch. (iii) Experimental–host distance; here the blue lines are averaged to find the distance between the host clutch (right) and an experimental egg (left, red). (iv) Simulated parasite–host distance; here the blue lines are averaged to find the distance between the host clutch (right) and a cuckoo finch egg (left, green; see main text). (d) Boxplot of the overall distribution of distance metrics based on NPM extraction of SIFT features: NPM intraclutch and NPM interclutch distances, NPM experimental–host distance, and NPM simulated parasite–host distance.

