
Figure 1.
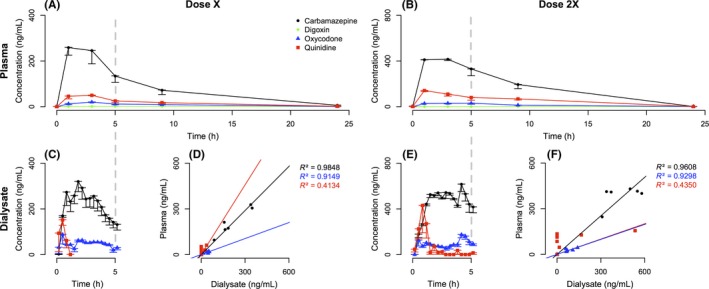
Plasma and brain pharmacokinetic of carbamazepine, digoxin, oxycodone, and quinidine. Analysis of plasma (A‐B) and microdialysis (C‐E) levels and of their relationship (D‐F) in awake normal macaques administered with carbamazepine (black dot), digoxin (green diamond), oxycodone (blue triangle), and quinidine (red square) at dose X (A‐C‐D) or dose 2X (B‐E‐F). Data are presented as mean ± with SEM