
Figure 1.
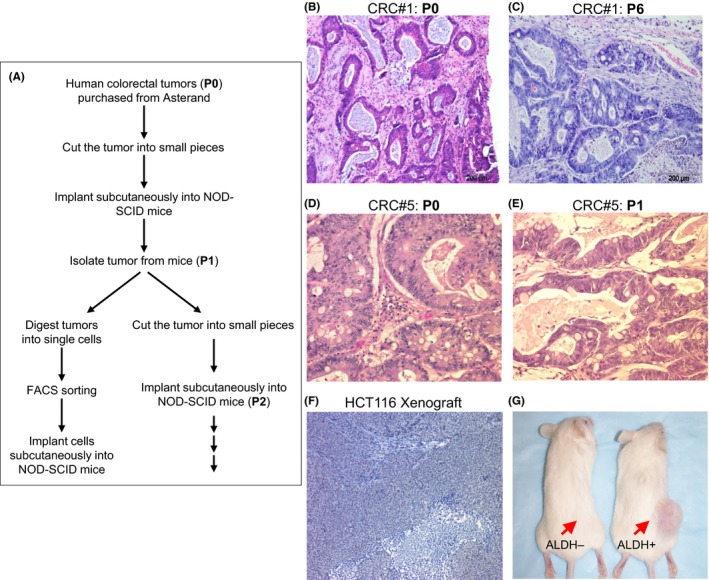
Human colorectal tumors implanted into NOD‐SCID mice preserve most of the tumor cell hierarchy. A, A flow chart of processing colorectal tumors. (B and C) H&E staining of CRC#1 at Passage 0 (P0) and Passage 6 (P6). (D and E) H&E staining of CRC#5 at Passage 0 (P0) and Passage 1 (P1). F, H&E staining of xenograft tumors generated from a colorectal cancer cell line, HCT116. G, ALDH FACS‐sorted CRC#2 cells were subcutaneously injected into the flank of NOD‐SCID mice