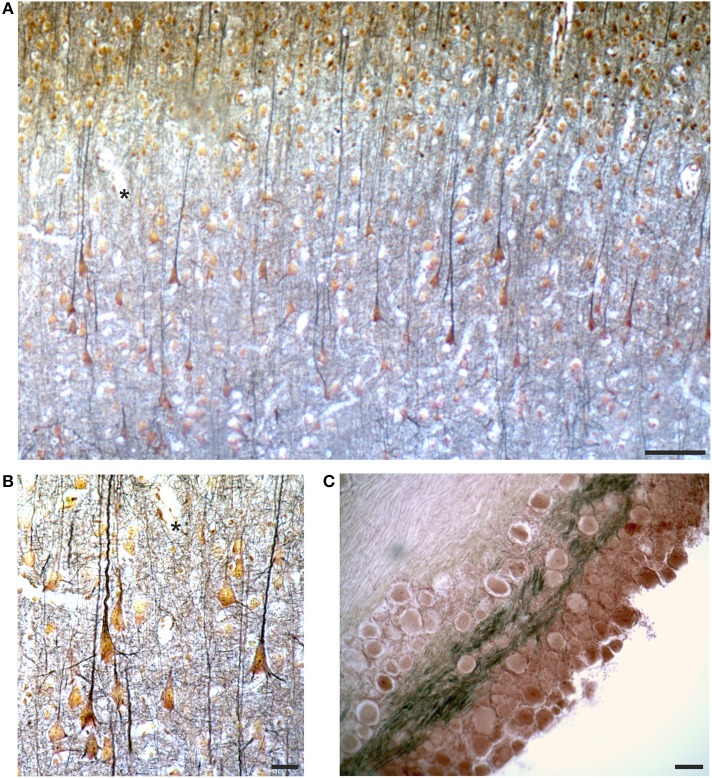
Figure 10.
Images from the slides labeled as “Cajal” by Golgi (see Figure 3D), containing a section from the occipital cortex of the rabbit (A,B) and a ganglion (C), respectively. In (A,B) the asterisks mark the same field for spatial reference. See text for comments on the Cajal stain. Scale bars: 100 μm in (A,C), 25 μm in (B).

