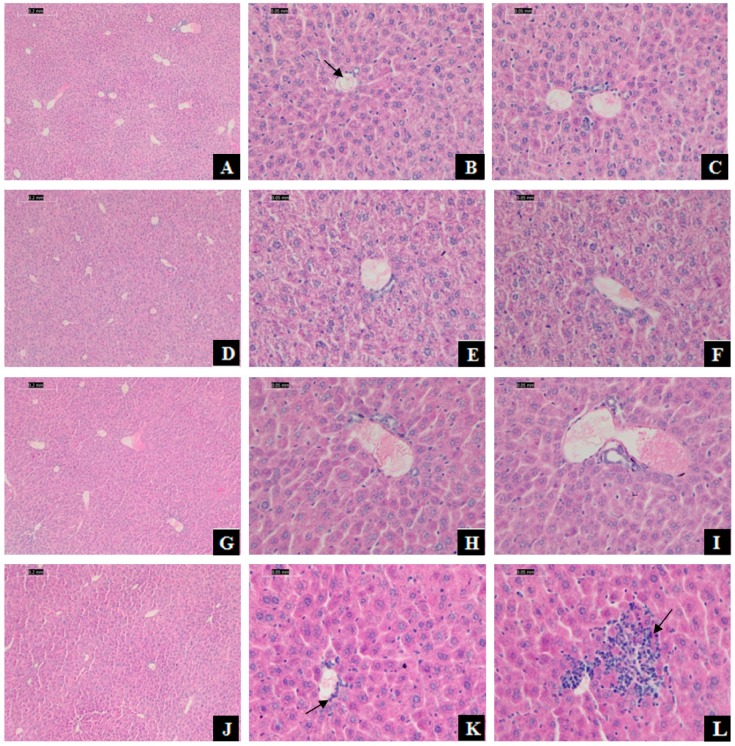
Figure 2.
Effect of DEHP exposure on histopathology of mice liver. Photomicrographs of sections stained with hematoxylin-eosin (H&E) from mice liver tissue. Scale bar was 0.2 and 0.5 mm. (A–C): Hepatic cross-sections from the control group (treated with corn oil), with the normal hepatic lobules and cell structure, the cells radially arranged around the central vein (B: arrowhead) to form the hepatic cord; (D–F): Hepatic cross-sections from 125 mg/kg DEHP group; (G–I): Hepatic cross-sections from 250 mg/kg DEHP group; (J–L): Hepatic cross-sections from 375 mg/kg DEHP group with a small agglomeration of leukocytes in the venule (K: arrowhead) and inflammatory cells infiltration (L: arrowhead).

